r_code
Importing Data from other Statistical Sofware - haven
参考 Schouwenaars (2016)
读取其他统计软件的数据文件。
library(knitr)
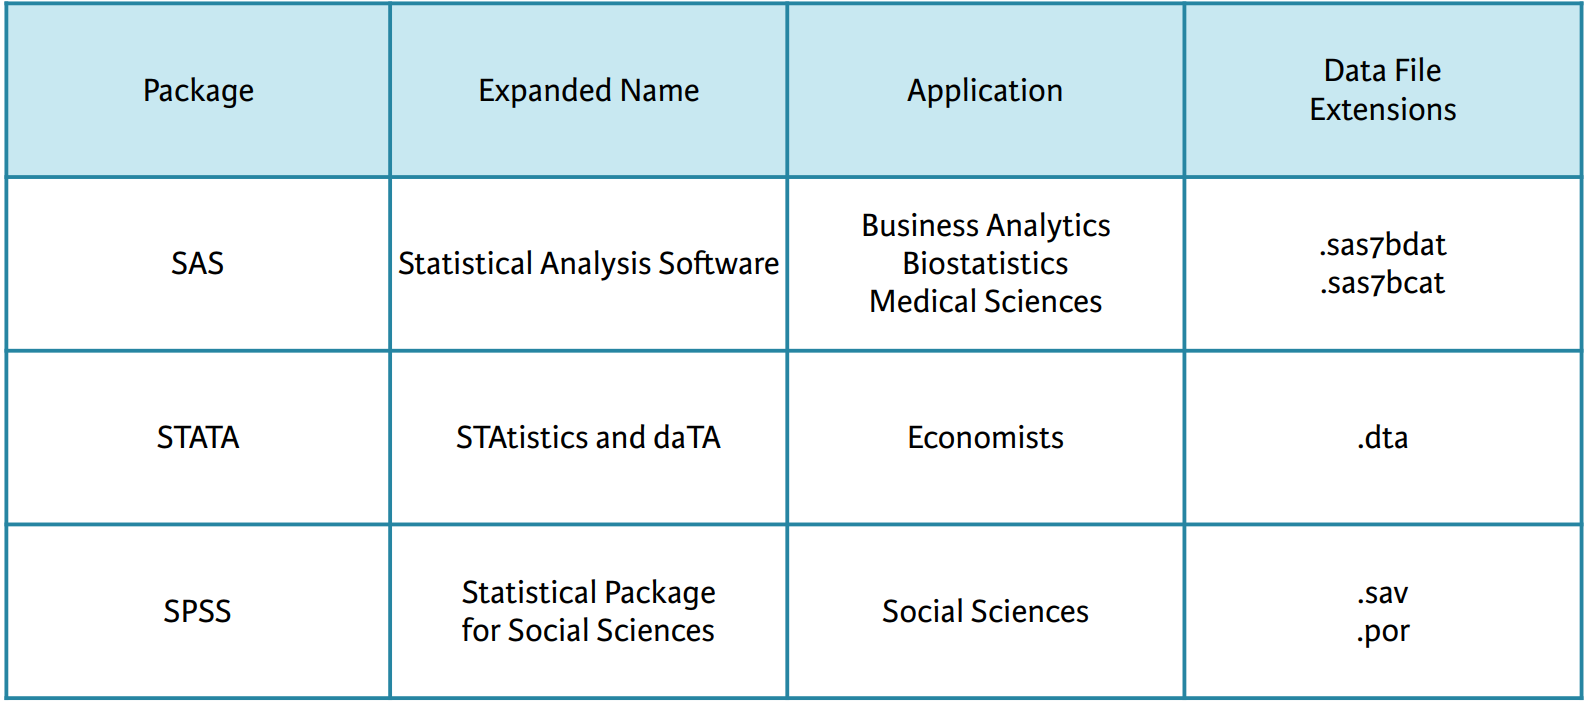
include_graphics("figure/file-type-diff-stats-software.png")

其中比较熟悉的是 stata,主要是给经济学家使用的。
一般有两个包可以使用
- haven by Hadley Wickham
- foreign by R Core Team
由于 Hadley 名气很大,因此主要介绍前者。
sas
# Load the haven package
library(haven)

# Import sales.sas7bdat: sales
sales <- read_sas("datasets/sales.sas7bdat")

# Display the structure of sales
str(sales)
## Classes 'tbl_df', 'tbl' and 'data.frame':    431 obs. of  4 variables:
##  $ purchase: num  0 0 1 1 0 0 0 0 0 0 ...
##  $ age     : num  41 47 41 39 32 32 33 45 43 40 ...
##  $ gender  : chr  "Female" "Female" "Female" "Female" ...
##  $ income  : chr  "Low" "Low" "Low" "Low" ...
##  - attr(*, "label")= chr "SALES"
可以看到导入的数据格式就是 data.frame,因此非常方便。
stata
When inspecting the result of the
read_dta()call, you will notice that one column will be imported as alabelledvector, an R equivalent for the common data structure in other statistical environments. In order to effectively continue working on the data in R, it’s best to change this data into a standard R class. To convert a variable of the classlabelledto a factor, you’ll need haven’sas_factor()function. DataCamp
这是普遍经济学家得到一个 data.frame 时,喜欢的习惯——一个简称,一个解释。
# haven is already loaded

# Import the data from the URL: sugar
sugar <- read_dta("datasets/trade.dta")

# Structure of sugar
str(sugar)
## Classes 'tbl_df', 'tbl' and 'data.frame':    10 obs. of  5 variables:
##  $ Date    : 'haven_labelled' num  10 9 8 7 6 5 4 3 2 1
##   ..- attr(*, "label")= chr "Date"
##   ..- attr(*, "format.stata")= chr "%9.0g"
##   ..- attr(*, "labels")= Named num  1 2 3 4 5 6 7 8 9 10
##   .. ..- attr(*, "names")= chr  "2004-12-31" "2005-12-31" "2006-12-31" "2007-12-31" ...
##  $ Import  : num  37664782 16316512 11082246 35677943 9879878 ...
##   ..- attr(*, "label")= chr "Import"
##   ..- attr(*, "format.stata")= chr "%9.0g"
##  $ Weight_I: num  54029106 21584365 14526089 55034932 14806865 ...
##   ..- attr(*, "label")= chr "Weight_I"
##   ..- attr(*, "format.stata")= chr "%9.0g"
##  $ Export  : num  5.45e+07 1.03e+08 3.79e+07 4.85e+07 7.15e+07 ...
##   ..- attr(*, "label")= chr "Export"
##   ..- attr(*, "format.stata")= chr "%9.0g"
##  $ Weight_E: num  9.34e+07 1.58e+08 8.80e+07 1.12e+08 1.32e+08 ...
##   ..- attr(*, "label")= chr "Weight_E"
##   ..- attr(*, "format.stata")= chr "%9.0g"
##  - attr(*, "label")= chr "Written by R."
# Convert values in Date column to dates
sugar$Date <- as.Date(as_factor(sugar$Date))

# Structure of sugar again
str(sugar)
## Classes 'tbl_df', 'tbl' and 'data.frame':    10 obs. of  5 variables:
##  $ Date    : Date, format: "2013-12-31" "2012-12-31" ...
##  $ Import  : num  37664782 16316512 11082246 35677943 9879878 ...
##   ..- attr(*, "label")= chr "Import"
##   ..- attr(*, "format.stata")= chr "%9.0g"
##  $ Weight_I: num  54029106 21584365 14526089 55034932 14806865 ...
##   ..- attr(*, "label")= chr "Weight_I"
##   ..- attr(*, "format.stata")= chr "%9.0g"
##  $ Export  : num  5.45e+07 1.03e+08 3.79e+07 4.85e+07 7.15e+07 ...
##   ..- attr(*, "label")= chr "Export"
##   ..- attr(*, "format.stata")= chr "%9.0g"
##  $ Weight_E: num  9.34e+07 1.58e+08 8.80e+07 1.12e+08 1.32e+08 ...
##   ..- attr(*, "label")= chr "Weight_E"
##   ..- attr(*, "format.stata")= chr "%9.0g"
##  - attr(*, "label")= chr "Written by R."
其中 label 是以attr 加入的。
head(sugar)
## # A tibble: 6 x 5
##   Date         Import Weight_I    Export  Weight_E
##   <date>        <dbl>    <dbl>     <dbl>     <dbl>
## 1 2013-12-31 37664782 54029106  54505513  93350013
## 2 2012-12-31 16316512 21584365 102700010 158000010
## 3 2011-12-31 11082246 14526089  37935000  88000000
## 4 2010-12-31 35677943 55034932  48515008 112000005
## 5 2009-12-31  9879878 14806865  71486545 131800000
## 6 2008-12-31  1539992  1749318  12311696  18500014
spss
suppressMessages(library(tidyverse))
traits <- read_sav("datasets/person.sav")
summary(traits)
##     Neurotic      Extroversion   Agreeableness   Conscientiousness
##  Min.   : 0.00   Min.   : 5.00   Min.   :15.00   Min.   : 7.00
##  1st Qu.:18.00   1st Qu.:26.00   1st Qu.:39.00   1st Qu.:25.00
##  Median :24.00   Median :31.00   Median :45.00   Median :30.00
##  Mean   :23.63   Mean   :30.23   Mean   :44.55   Mean   :30.85
##  3rd Qu.:29.00   3rd Qu.:34.00   3rd Qu.:50.00   3rd Qu.:36.00
##  Max.   :44.00   Max.   :65.00   Max.   :73.00   Max.   :58.00
##  NA's   :14      NA's   :16      NA's   :19      NA's   :14
traits %>% head
## # A tibble: 6 x 4
##   Neurotic Extroversion Agreeableness Conscientiousness
##      <dbl>        <dbl>         <dbl>             <dbl>
## 1       39           38            31                12
## 2        6           38            27                12
## 3       17           39            32                13
## 4       28           35            39                13
## 5       26           35            46                14
## 6       17           37            28                15
Schouwenaars, Filip. 2016. “Importing Data in R (Part 2).” 2016.
<https://www.datacamp.com/courses/importing-data-in-r-part-2>.