R 函数书写 学习笔记
2019-08-29
- 使用 RMarkdown 的
child参数,进行文档拼接。 - 这样拼接以后的笔记方便复习。
- 相关问题提交到 GitHub
1 前言
how to convert a script into a function, and what order you should include the arguments. (Mayr 2019)
script => function 这是函数书写的主要思想。
参考 Mayr (2019) 学习函数书写一些技巧,如 invisible函数使用,这是 R 编程的一些非常 native 的东西。

pipeline 在函数开发的优缺点
pipeline 的方式,就是必须去相信内部函数,debug 很烦。
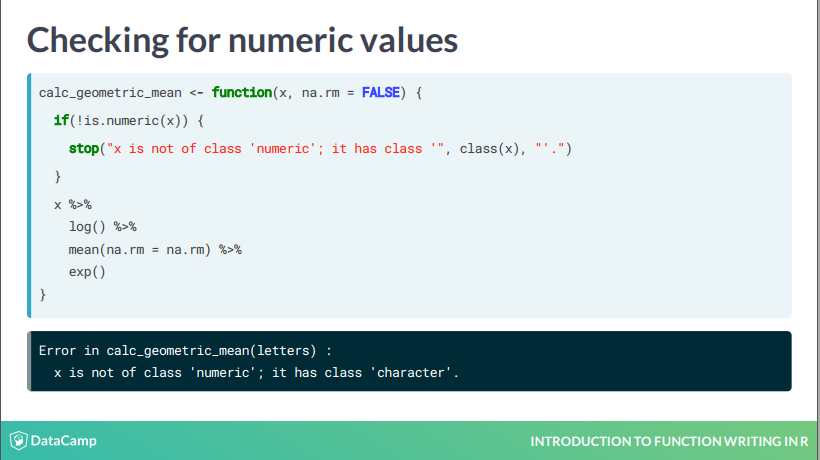
先查询变量的类型,这是很工程的写法。
可以使用 assert_is_numeric(x) 代替。
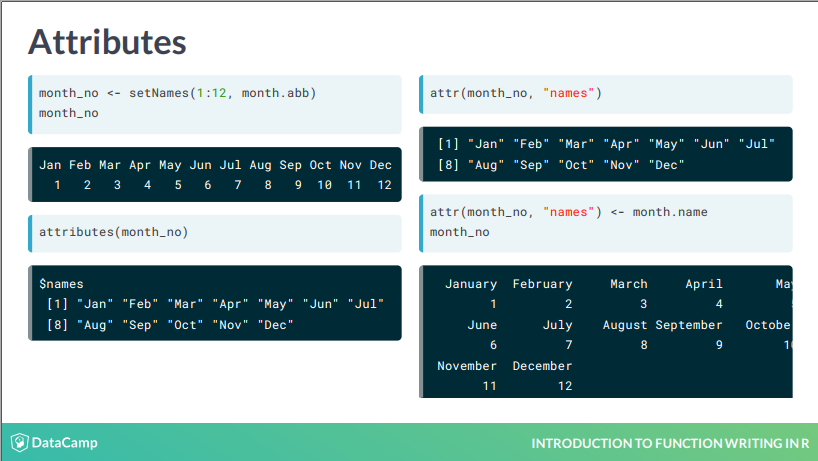
attrs 的使用
attrs 这个思想很不错。
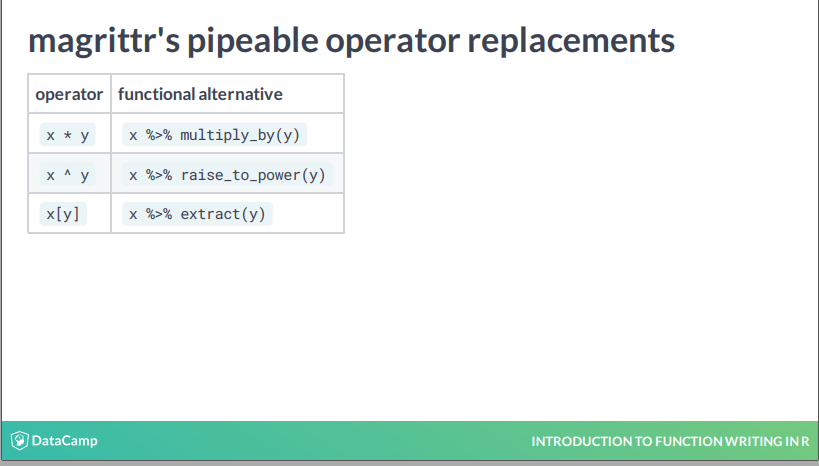
magrittr 内置一些函数
pipeline 已经开始封装了这类函数,方便使用者持续的使用 pipeline。
2 参数
2.1 args 书写
passing args by location or name (Mayr 2019)

位置也注意,很少用到的参数,给上 name。
自定义函数一是方便,二是 script 在复制粘贴过程中产生 typo。
rank(-gold_medals, na.last = "keep",ties.method = "min")USA GBR CHN RUS GER JPN FRA KOR ITA AUS NED HUN BRA ESP KEN JAM CRO CUB NZL CAN
1 2 3 4 5 6 7 8 9 9 9 9 13 13 15 15 17 17 19 19
UZB KAZ COL SUI IRI GRE ARG DEN SWE RSA UKR SRB POL PRK BEL THA SVK GEO AZE BLR
19 22 22 22 22 22 22 28 28 28 28 28 28 28 28 28 28 28 39 39
TUR ARM CZE ETH SLO INA ROU BRN VIE TPE BAH IOA CIV FIJ JOR KOS PUR SIN TJK MAS
39 39 39 39 39 39 39 39 39 39 39 39 39 39 39 39 39 39 39 60
MEX VEN ALG IRL LTU BUL IND MGL BDI GRN NIG PHI QAT NOR EGY TUN ISR AUT DOM EST
60 60 60 60 60 60 60 60 60 60 60 60 60 60 60 60 60 60 60 60
FIN MAR NGR POR TTO UAE IOC
60 60 60 60 60 60 NA2.2 function signature

所有的参数,相当于 function signature,算是 user interface。
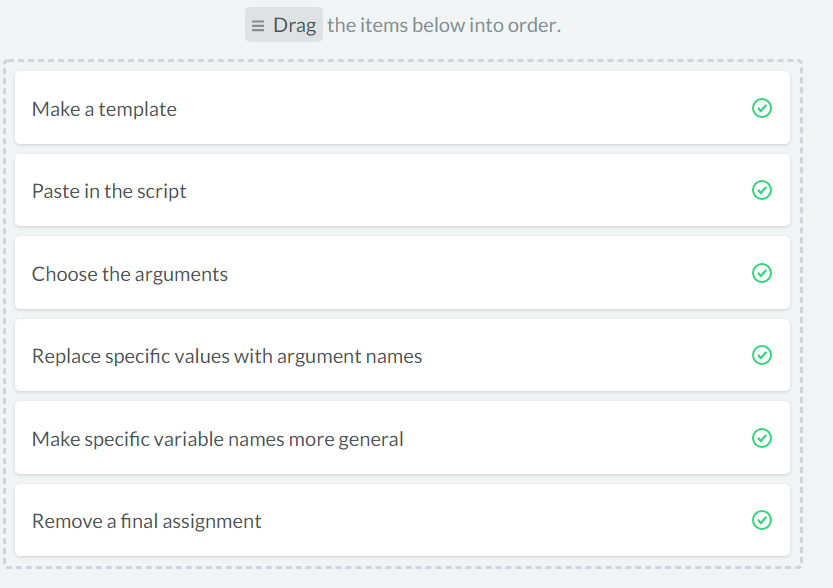
进入 body 时的五个步骤。
2.3 函数命名
- variable 是 object,因此是 noun
- function take action,因此是 verb
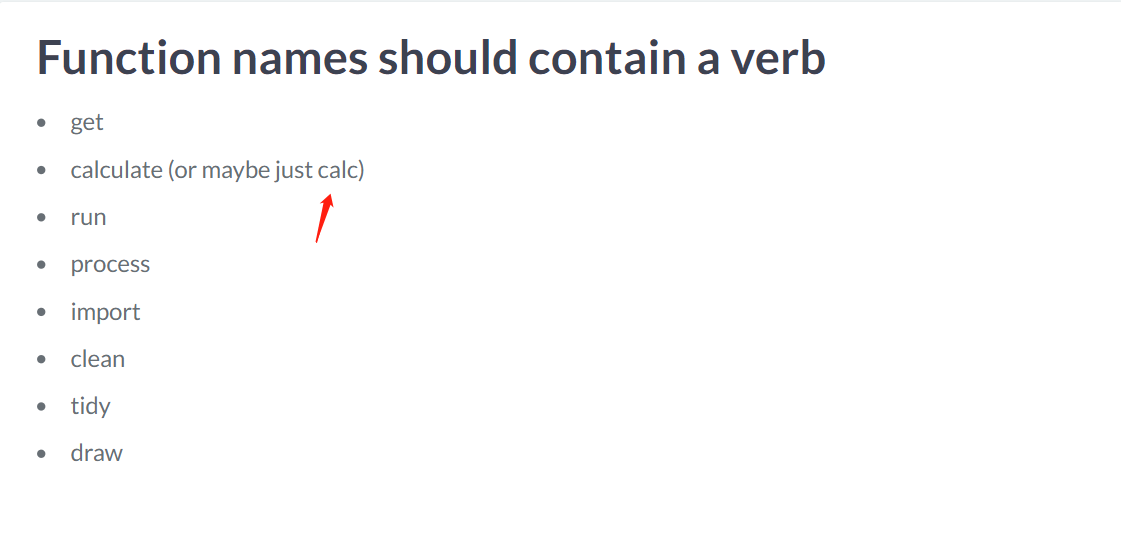
function take action,因此是 verb
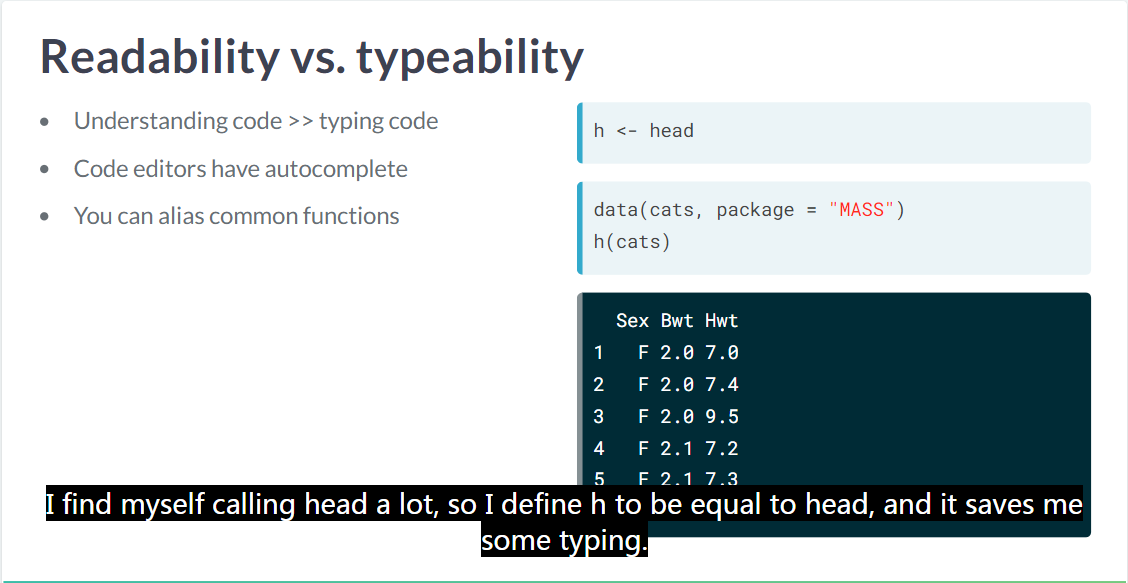
代码的可读性
这可以大量提高代码的可读性 而且大部分IDE都有 autocompletion 的功能,因此用常用动词是一个很好的想法 如果遇到没有按照这个规则的函数,可以 alias
2.4 args 分类
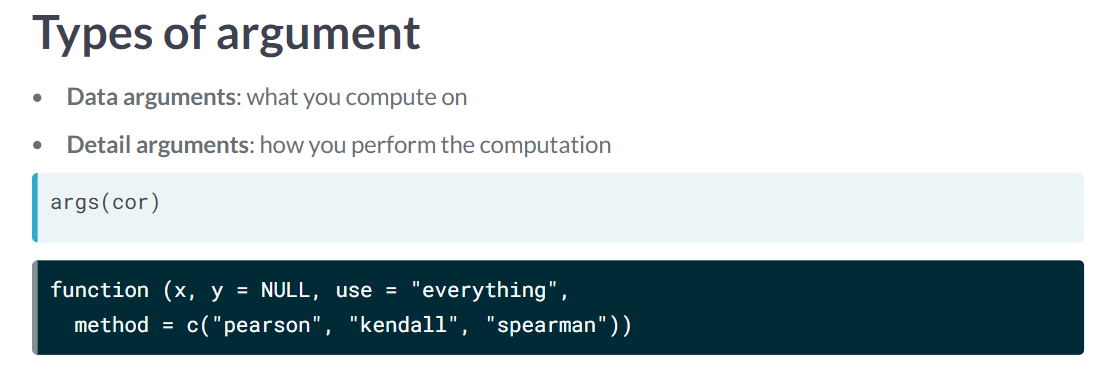
data args 和 detail args
Recall that data arguments are what a function computes on, and detail arguments advise on how the computation should be performed. (Mayr 2019)
Nice numeric default setting! Remember to only set defaults for numeric detail arguments, not data arguments. (Mayr 2019)
- data args 就是用于计算的,如
x和y,data argument 一般不给 default 的。 - detail args 就是帮助如何计算的
从 pipeline 角度,先写数据后,进行运算,因此 data 在前 detail 在后。
lm 的出现早于 pipeline,因此当时没有考虑 pipeline 的实现,因此现在我们可以重写这个函数。
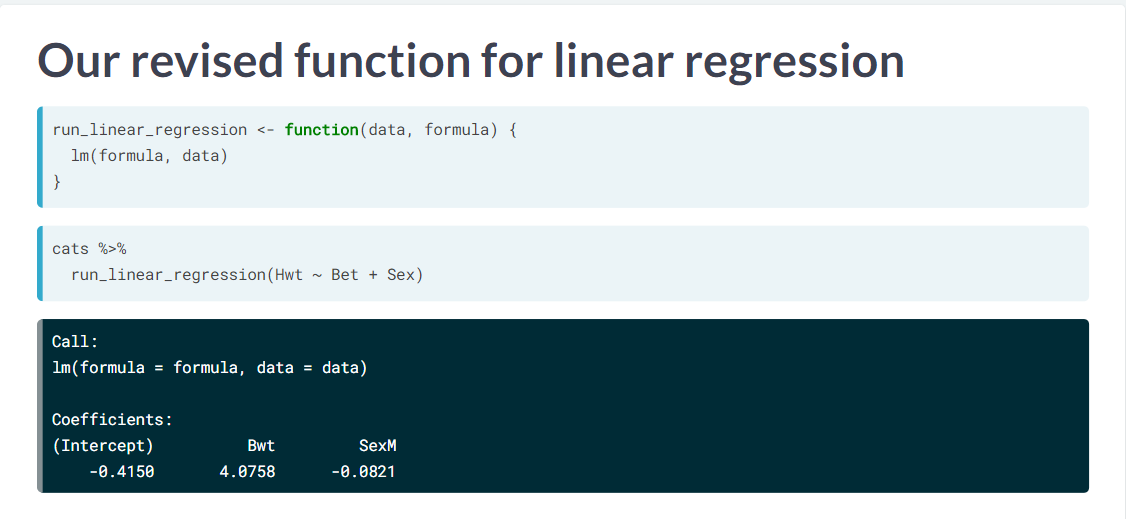
其实就是在 function signature 内部调整参数的顺序即可。
2.5 pipeline 参数调整
R’s generalized linear regression function,
glm(), suffers the same usability problems aslm(): its name is an acronym, and its formula and data arguments are in the wrong order. (Mayr 2019)
glm() 也有同样的问题。
使用到数据
data(COUNT::loomis)# From previous step
run_poisson_regression <- function(data, formula) {
glm(formula, data, family = poisson)
}
# Re-run the Poisson regression, using your function
model <- snake_river_visits %>%
run_poisson_regression(n_visits ~ gender + income + travel)
# Run this to see the predictions
snake_river_explanatory %>%
mutate(predicted_n_visits = predict(model, ., type = "response"))%>%
arrange(desc(predicted_n_visits))注意function(data, formula)中参数的顺序。
3 参数类别
3.1 函数之间共享参数
Learn how to set defaults for arguments, how to pass arguments between functions, and how to check that users specified arguments correctly. (Mayr 2019)
这可以在很多函数中完成,然后保留其他参数 ... 。
函数之间互传 arg 这个还是不错的。
3.2 NULL defaults
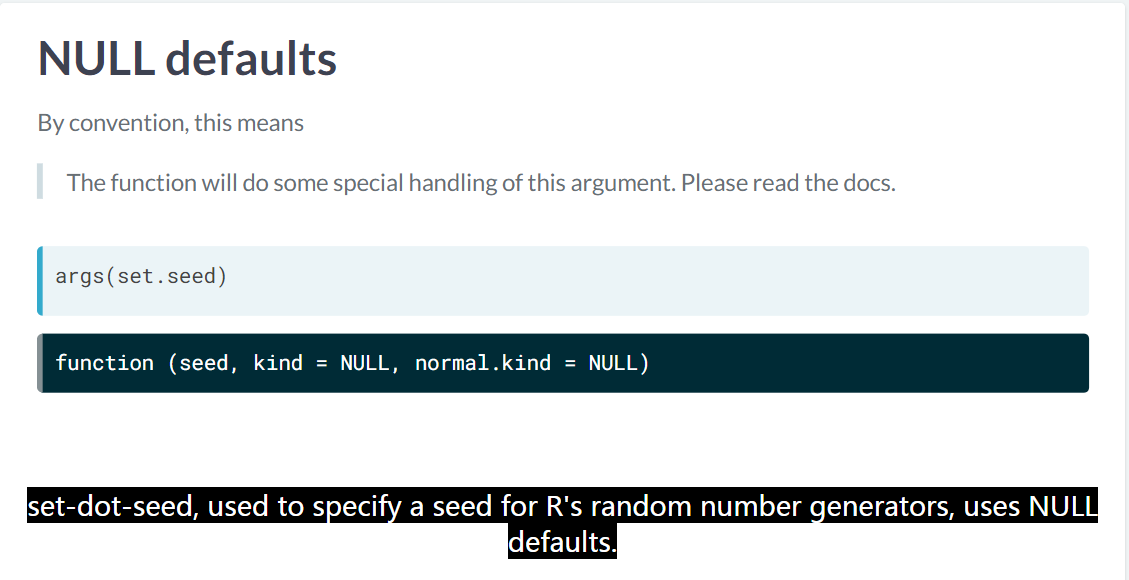
NULL default
NULL default 说明默认参数太难写,可能 list 很长,建议读者好好读文档。 参考 https://stackoverflow.com/a/6553189/8625228
my.function <- function(my.arg = NULL) {
  if (is.null(my.arg))
    ...
}
3.3 category default
# Set the default for n to 5
cut_by_quantile <- function(x, n = 5, na.rm, labels, interval_type) {
  probs <- seq(0, 1, length.out = n + 1)
  qtiles <- quantile(x, probs, na.rm = na.rm, names = FALSE)
  right <- switch(interval_type, "(lo, hi]" = TRUE, "[lo, hi)" = FALSE)
  cut(x, qtiles, labels = labels, right = right, include.lowest = TRUE)
}

# Remove the n argument from the call
cut_by_quantile(
  n_visits,
  5,
  na.rm = FALSE,
  labels = c("very low", "low", "medium", "high", "very high"),
  interval_type = "(lo, hi]"
)
interval_type 参数搭配上 switch 函数,其实就是 case_when 逻辑,也可以使用
magrittr::extract()替代。
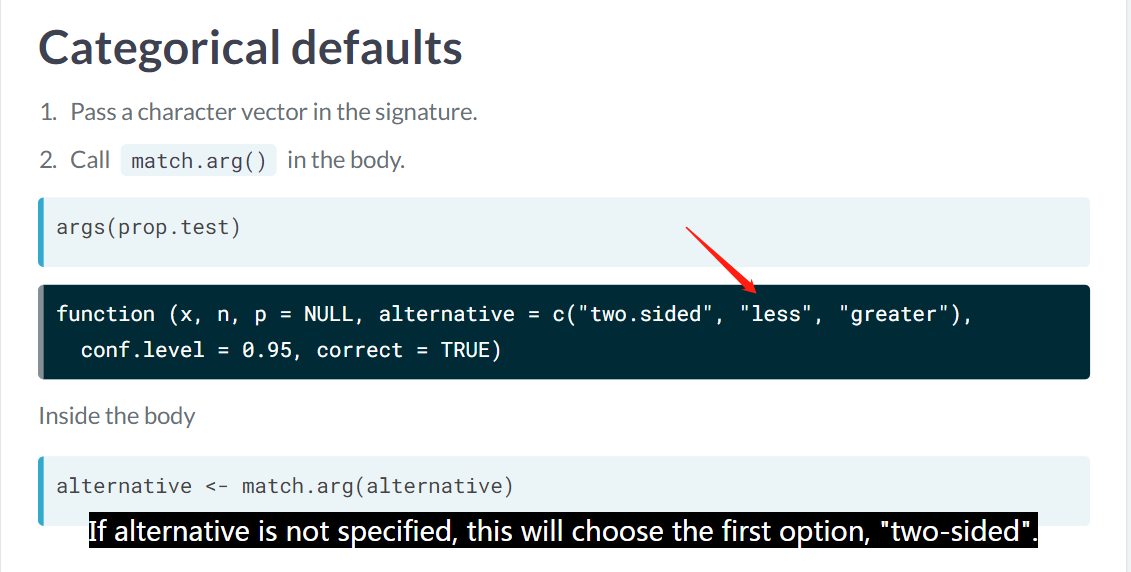
category default
match.arg()类似于 %in% 的逻辑。
As a bonus,
match.arg()handles throwing an error if the user types a value that wasn’t specified.
match.arg() 如果没有列举,那么就会报错。
> cut_by_quantile(n_visits, interval_type = "123")
Error: 'arg' should be one of "(lo, hi]", "[lo, hi)"
# Set the categories for interval_type to "(lo, hi]" and "[lo, hi)"
cut_by_quantile <- function(x, n = 5, na.rm = FALSE, labels = NULL,
interval_type = c("(lo, hi]", "[lo, hi)")) {
# Match the interval_type argument
interval_type <- match.arg(interval_type)
probs <- seq(0, 1, length.out = n + 1)
qtiles <- quantile(x, probs, na.rm = na.rm, names = FALSE)
right <- switch(interval_type, "(lo, hi]" = TRUE, "[lo, hi)" = FALSE)
cut(x, qtiles, labels = labels, right = right, include.lowest = TRUE)
}
# Remove the interval_type argument from the call
cut_by_quantile(n_visits)3.4 dot 参数使用
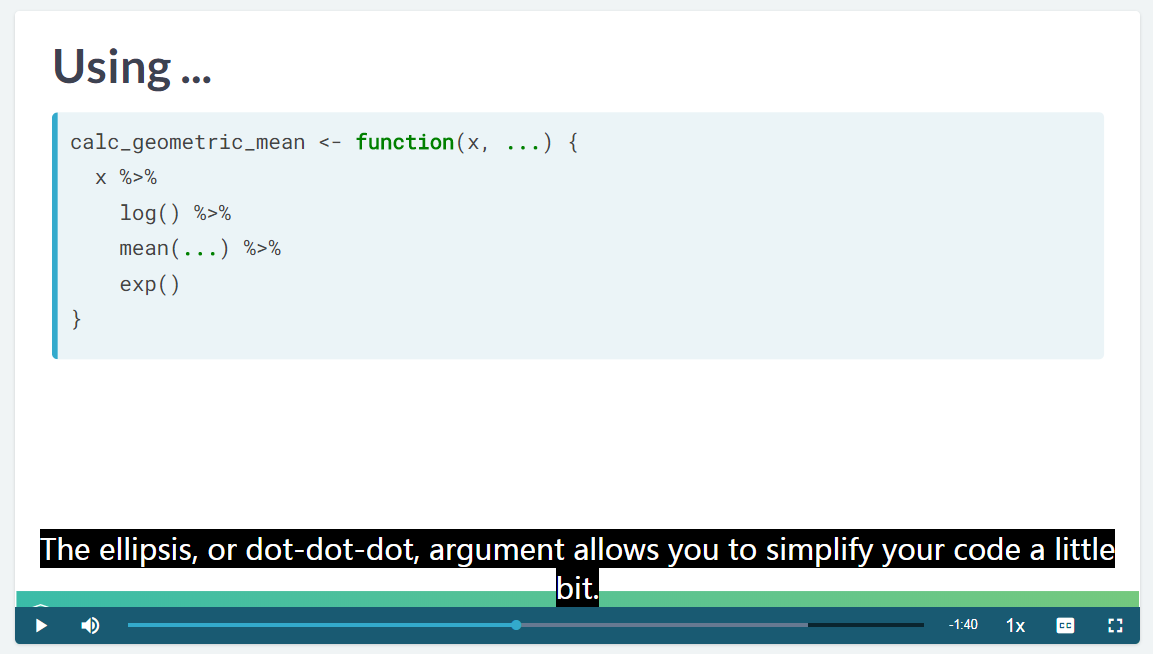
...可以替代默认的其他参数

但是是有 tradeoff 的
user 不等不读底层函数来理解目前的函数。
3.5 harmonic mean
调和平均数。
The harmonic mean is often used to average ratio data. You’ll be using it on the price/earnings ratio of stocks in the Standard and Poor’s 500 index, provided as std_and_poor500. Price/earnings ratio is a measure of how expensive a stock is. (Mayr 2019)
调和平均数,常用来处理 ratio 数据。
# From previous step
calc_harmonic_mean <- function(x, na.rm = FALSE) {
  x %>%
    get_reciprocal() %>%
    mean(na.rm = na.rm) %>%
    get_reciprocal()
}

std_and_poor500 %>%
  # Group by sector
  group_by(sector) %>%
  # Summarize, calculating harmonic mean of P/E ratio
  summarise(hmean_pe_ratio = calc_harmonic_mean(pe_ratio, na.rm = TRUE)) %>%
  arrange(desc(hmean_pe_ratio))
分离函数是因为 get_reciprocal 要被调用两次。
# A tibble: 11 x 2
   sector                 hmean_pe_ratio
   <chr>                           <dbl>
 1 Real Estate                      32.5
 2 Health Care                      26.6
 3 Utilities                        23.9
 4 Information Technology           21.6
 5 Consumer Staples                 19.8
 6 Industrials                      18.2
 7 Communication Services           17.5
 8 Materials                        16.3
 9 Consumer Discretionary           15.2
10 Energy                           13.7
11 Financials                       12.9
Real Estate is by far the most expensive sector. (Mayr 2019)

就是同一个函数的嵌套。
3.6 Checking arguments
The code for providing the error message is called an assertion. (Mayr 2019)
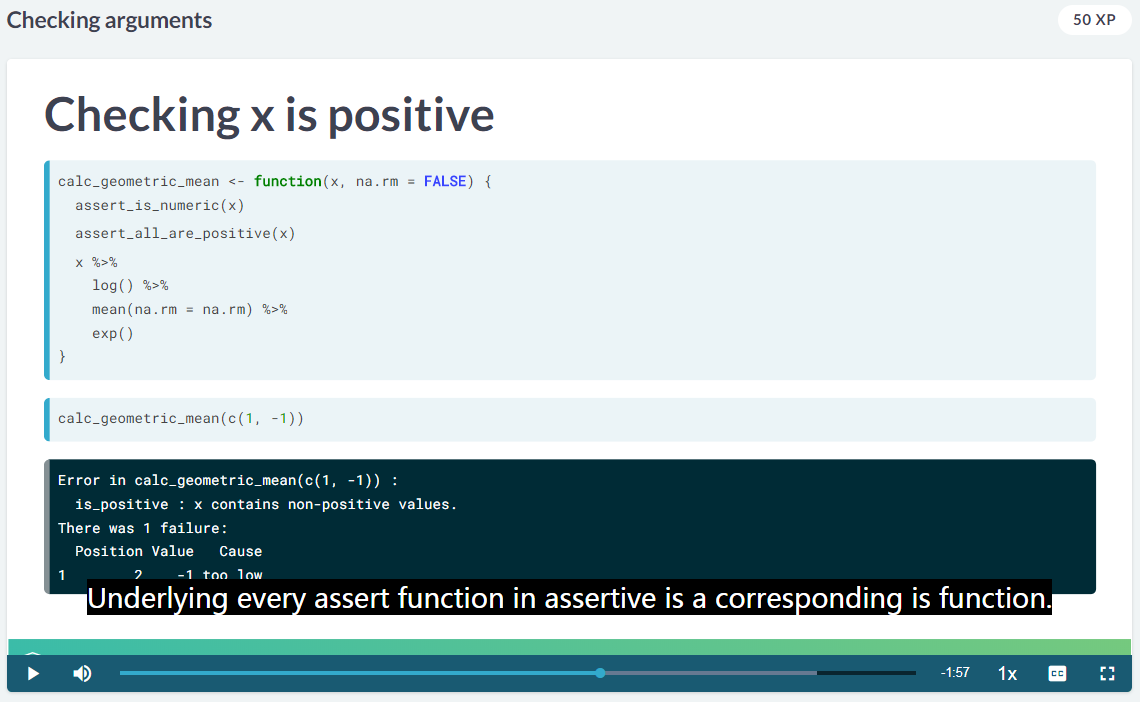
正数的检验
这是 Mayr (2019) 写的一个包 assertive。

使用第一个数据
calc_harmonic_mean <- function(x, na.rm = FALSE) {
  # Assert that x is numeric
  assertive::assert_is_numeric(x)
  x %>%
    get_reciprocal() %>%
    mean(na.rm = na.rm) %>%
    get_reciprocal()
}

# See what happens when you pass it strings
calc_harmonic_mean(std_and_poor500$sector)
calc_harmonic_mean <- function(x, na.rm = FALSE) {
assert_is_numeric(x)
# Check if any values of x are non-positive
if(any(is_non_positive(x), na.rm = TRUE)) {
# Throw an error
stop("x contains non-positive values, so the harmonic mean makes no sense.")
}
x %>%
get_reciprocal() %>%
mean(na.rm = na.rm) %>%
get_reciprocal()
}
# See what happens when you pass it negative numbers
calc_harmonic_mean(std_and_poor500$pe_ratio - 20)3.6.1 自定义 assertion
# Update the function definition to fix the na.rm argument
calc_harmonic_mean <- function(x, na.rm = FALSE) {
  assert_is_numeric(x)
  if(any(is_non_positive(x), na.rm = TRUE)) {
    stop("x contains non-positive values, so the harmonic mean makes no sense.")
  }
  # Use the first value of na.rm, and coerce to logical
  na.rm <- coerce_to(use_first(na.rm), target_class = "logical")
  x %>%
    get_reciprocal() %>%
    mean(na.rm = na.rm) %>%
    get_reciprocal()
}

# See what happens when you pass it malformed na.rm
calc_harmonic_mean(std_and_poor500$pe_ratio, na.rm = 1:5)
默认处理了,还给了 warning。
> calc_harmonic_mean(std_and_poor500$pe_ratio, na.rm = 1:5)
Warning message: Only the first value of na.rm (= 1) will be used.
Warning message: Coercing use_first(na.rm) to class 'logical'.
[1] 18.23871
4 输出和环境
4.1 return
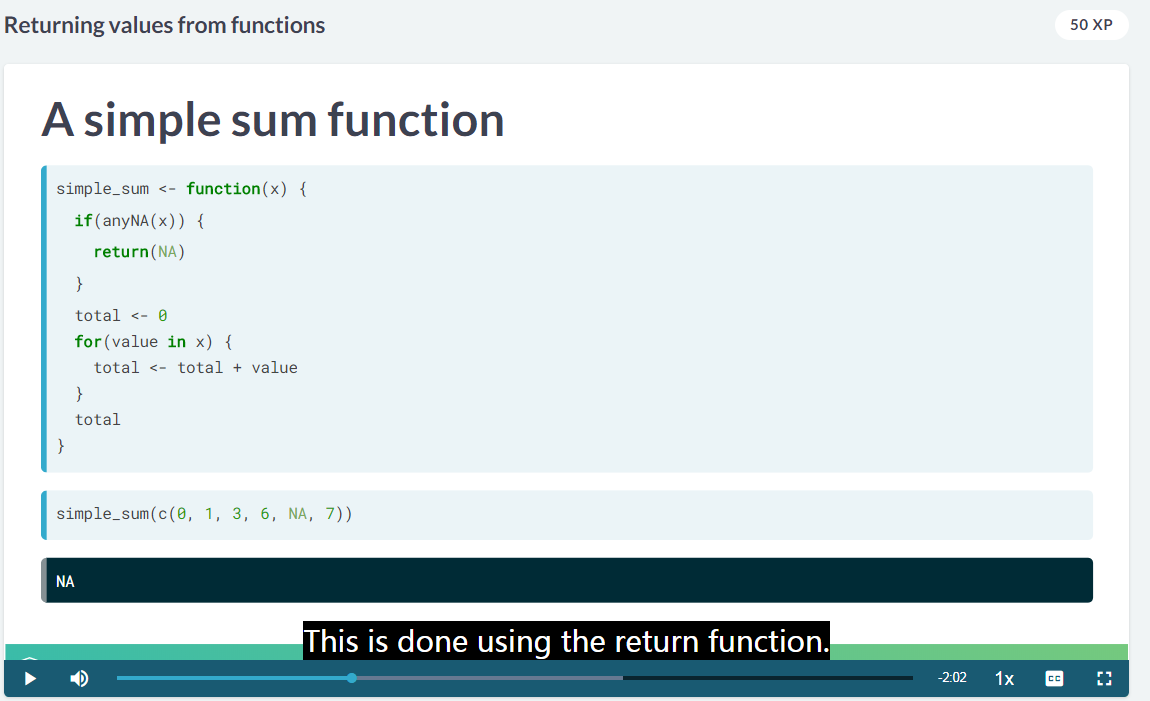
return 的使用场景
return 的使用场景一是前面可以直接 return 了,下面就停止运算了。
另外一个场景是温和的 stop,这个直接 stop 有点烦,太 harsh 了。
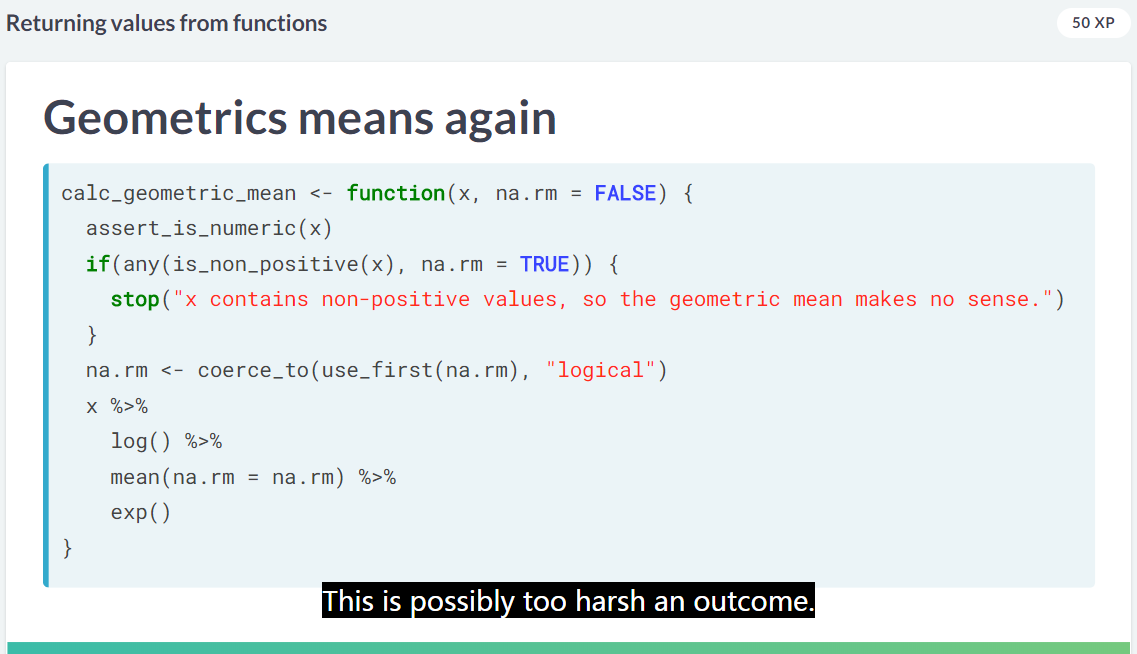
stop 的应用场景
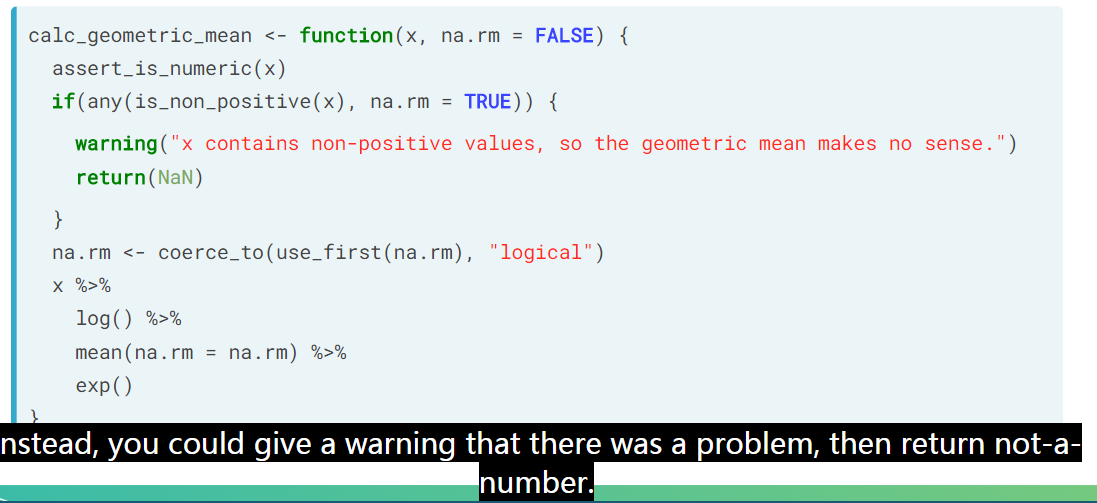
温和的 stop
这样或许用户更加友好一点。
4.2 invisible
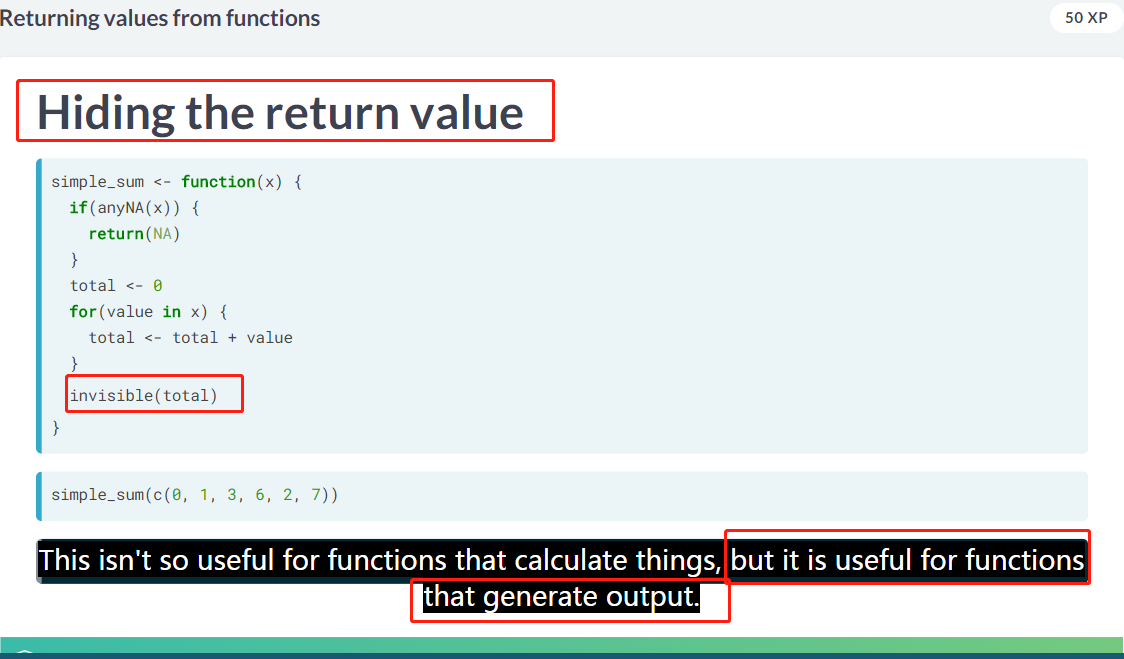
invisible的使用场景
可以方便不传任何东西在 console,在调用对象时,才反馈。
That means they don’t print any output in the console. (Mayr 2019)
闰年这个函数把 return 参数写的很精彩。
is_leap_year <- function(year) {
  # If year is div. by 400 return TRUE
  if(year %% 400 == 0) {
    return(TRUE)
  }
  # If year is div. by 100 return FALSE
  if(year %% 100 == 0) {
    return(FALSE)
  }
  # If year is div. by 4 return TRUE
  if(year %% 4 == 0) {
    return(TRUE)
  }


  # Otherwise return FALSE
  return(FALSE)
}
When the main purpose of a function is to generate output, like drawing a plot or printing something in the console, you may not want a return value to be printed as well. In that case, the value should be invisibly returned. (Mayr 2019)
这是 invisible 函数的功用。
> # Using cars, draw a scatter plot of dist vs. speed
> plt_dist_vs_speed <- plot(dist ~ speed, data = cars)
>
> # Oh no! The plot object is NULL
> plt_dist_vs_speed
NULL
因此有 output (图片),但是没有 return value (NULL)。
# Define a scatter plot fn with data and formula args
pipeable_plot <- function(data, formula) {
  # Call plot() with the formula interface
  plot(formula, data)
  # Invisibly return the input dataset
  invisible(data)
}

# Draw the scatter plot of dist vs. speed again
plt_dist_vs_speed <- cars %>%
  pipeable_plot(dist ~ speed)
这里只展示了 output,但是没有反馈 return value。
# Now the plot object has a value
plt_dist_vs_speed
return 是data
> plt_dist_vs_speed
   speed dist
1      4    2
2      4   10
3      7    4
4      7   22
5      8   16
6      9   10
...
Premium pipeable plotting! Return values are usually desirable (so you can use the objects in later code), even if you don’t want them printing to the console. (Mayr 2019)
在当前状态不 print,但是在调用的时候会 print!太棒了,应用场景很好!
4.3 mutiple-assignment
In Python, this is called unpacking variables. (Mayr 2019)
If users want to have the list items as separate variables, they can assign each list element to its own variable using zeallot’s multi-assignment operator, %<-%. (Mayr 2019)
mutiple-assignment 这是 Python 的思路。

mutiple-assignment 在 R中以 c()展示
# Look at the structure of model (it's a mess!)
str(model)

# Use broom tools to get a list of 3 data frames
list(
  # Get model-level values
  model = glance(model),
  # Get coefficient-level values
  coefficients = tidy(model),
  # Get observation-level values
  observations = augment(model)
)
这是使用 broom 包的一个新思路。
# From previous step
groom_model <- function(model) {
  list(
    model = glance(model),
    coefficients = tidy(model),
    observations = augment(model)
  )
}

# Call groom_model on model, assigning to 3 variables
c(mdl, cff, obs) %<-% groom_model(model)

# See these individual variables
mdl; cff; obs %<-% groom_model(model)
4.4 attr
Sometimes you want the return multiple things from a function, but you want the result to have a particular class (for example, a data frame or a numeric vector), so returning a list isn’t appropriate. (Mayr 2019)
这是 attr 的需求。
This is common when you have a result plus metadata about the result. (Metadata is “data about the data”. For example, it could be the file a dataset was loaded from, or the username of the person who created the variable, or the number of iterations for an algorithm to converge.) (Mayr 2019)
这是 attr 的需求的例子。
pipeable_plot <- function(data, formula) {
  plot(formula, data)
  # Add a "formula" attribute to data
  attr(data, "formula") <- formula
  invisible(data)
}

# From previous exercise
plt_dist_vs_speed <- cars %>%
  pipeable_plot(dist ~ speed)

# Examine the structure of the result
str(plt_dist_vs_speed)
这是 attr 的一个例子。
> str(plt_dist_vs_speed)
'data.frame':   50 obs. of  2 variables:
 $ speed: num  4 4 7 7 8 9 10 10 10 11 ...
 $ dist : num  2 10 4 22 16 10 18 26 34 17 ...
 - attr(*, "formula")=Class 'formula'  language dist ~ speed
  .. ..- attr(*, ".Environment")=<environment: 0x564de166ba00>
4.5 Environments
Most of the time, you can think of environments as special lists. (Mayr 2019)
environment 存储对象是也是以 list 为结构的,因此可以书 environment 是一种特殊的 list。
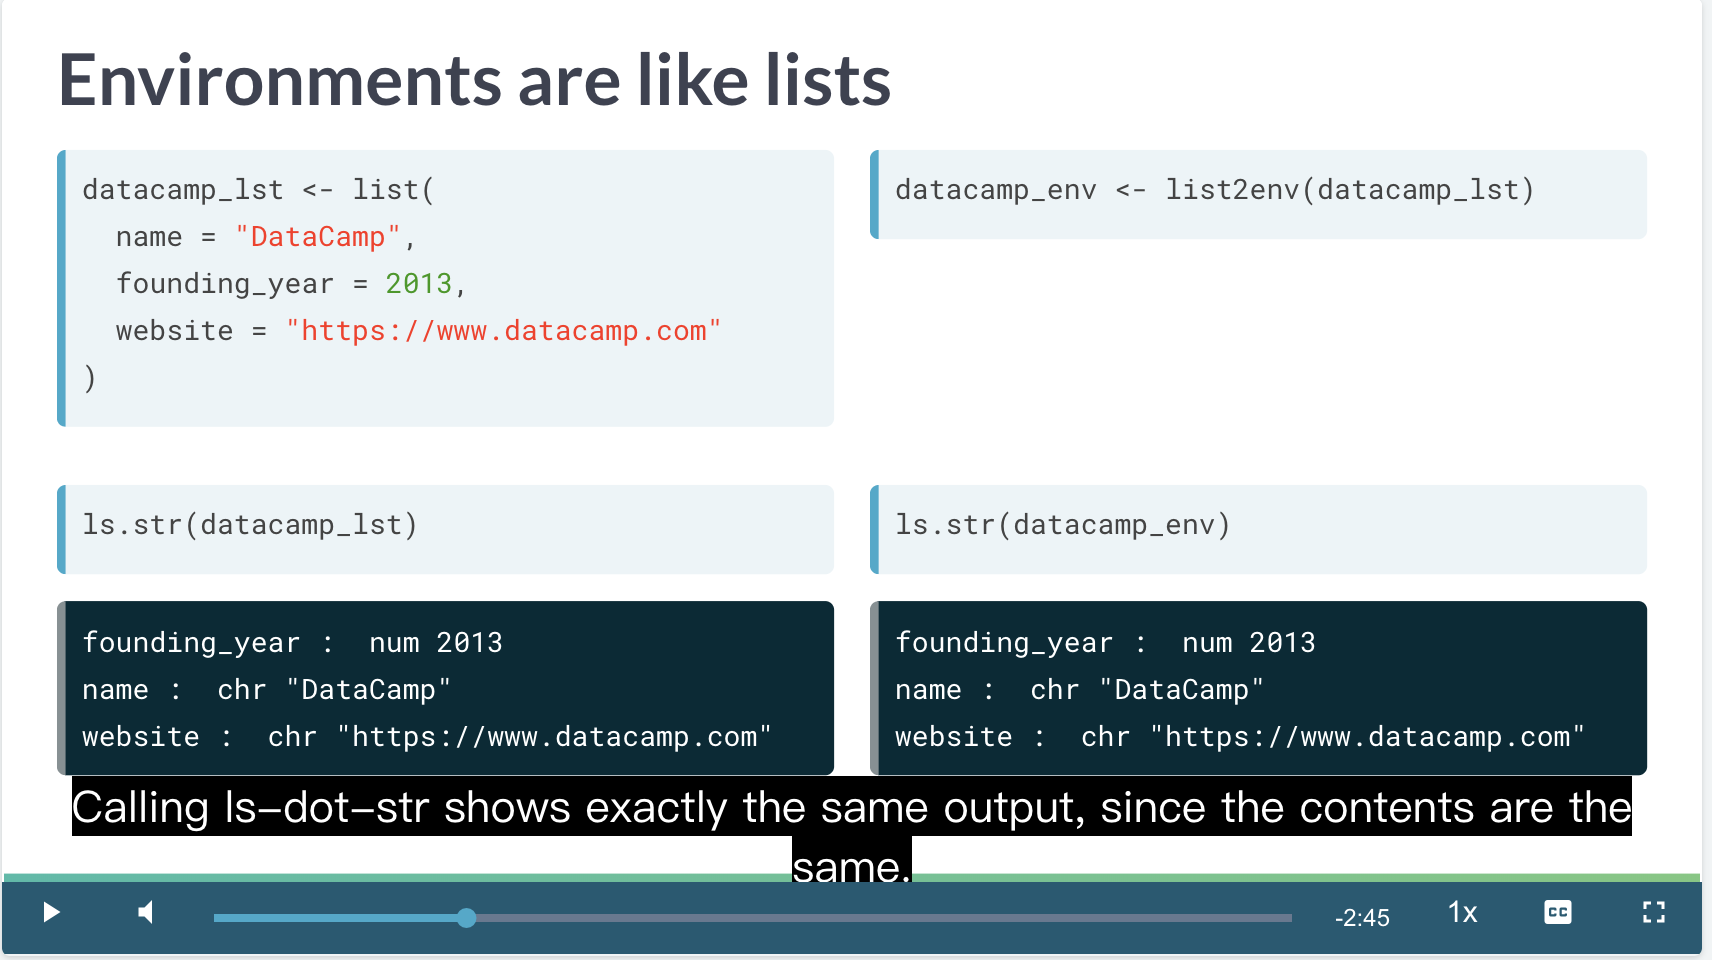
environment 是特殊的 list
此时此刻,environment 还表现出和 list 的共性。


environment 相比较于 list 的特殊之处在于他有 parent-child 结构。 类似于 matrvoshka dolls 俄罗斯套娃。
这里可以看到
datacamp_env=>R_GlobalEnv=>package:stats=.GlobalEnvsearch()反馈的是当前 global 下的所有 parents。exists()函数是检验对象是否在某个环境中。
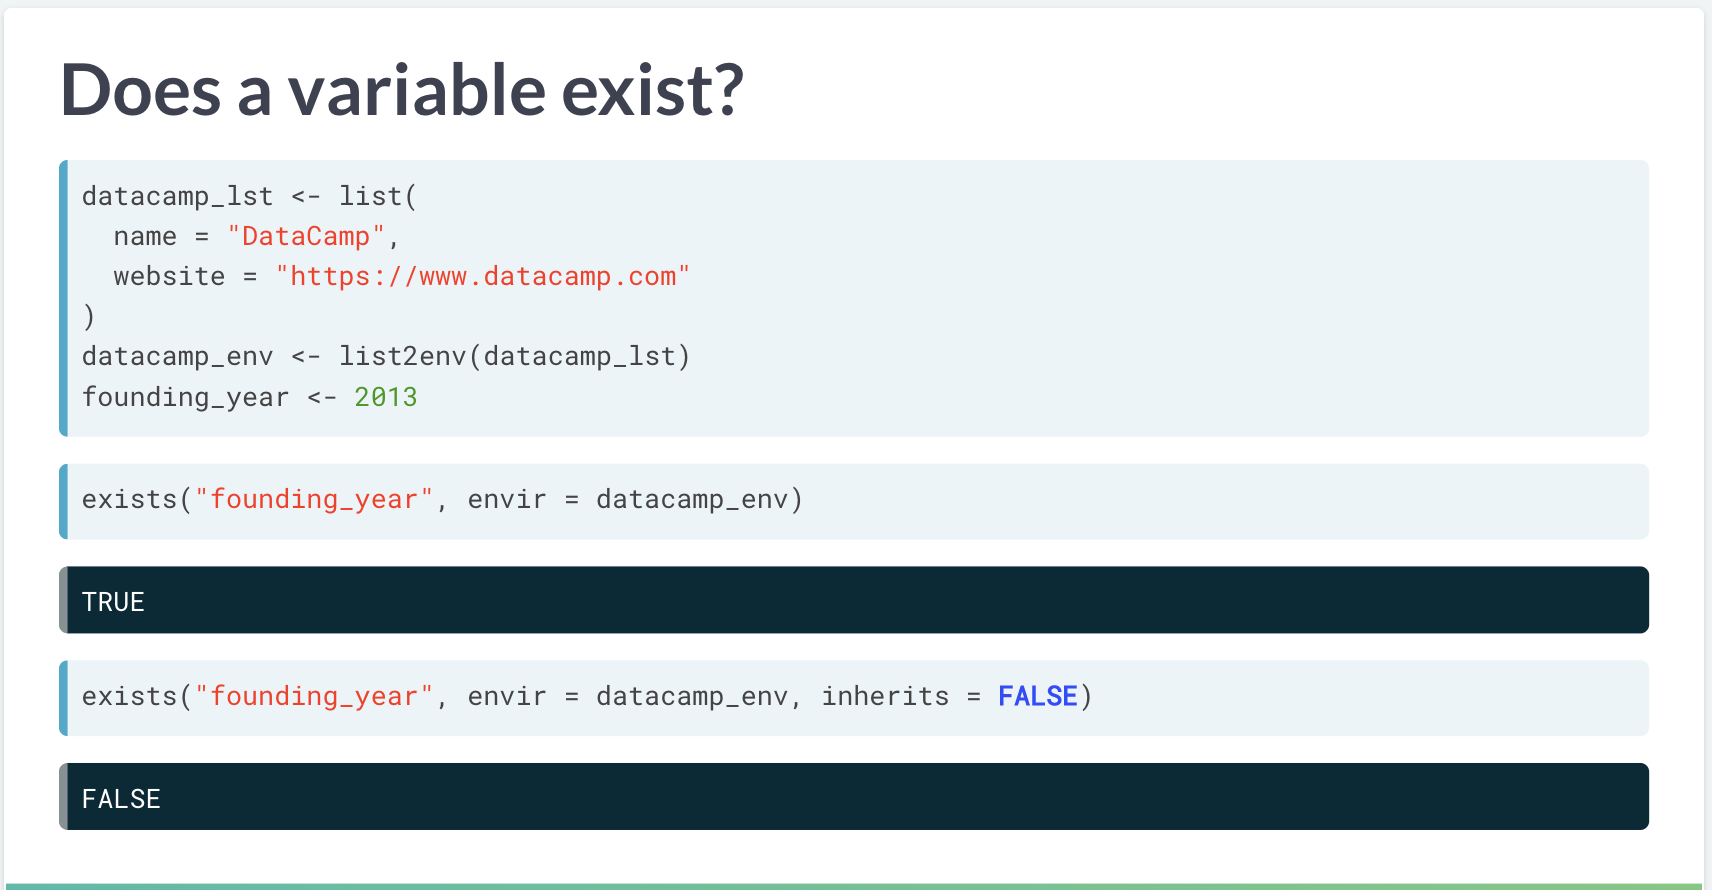
exists 函数使用
它是贪婪机制 (greedy child),在当前环境没找到时,会持续往上层环境寻找。
# Add capitals, national_parks, & population to a named list
rsa_lst <- list(
  capitals = capitals,
  national_parks = national_parks,
  population = population
)

# List the structure of each element of rsa_lst
ls.str(rsa_lst)
# From previous step
rsa_lst <- list(
capitals = capitals,
national_parks = national_parks,
population = population
)
# Convert the list to an environment
rsa_env <- list2env(rsa_lst)
# List the structure of each variable
ls.str(rsa_env)# From previous steps
rsa_lst <- list(
capitals = capitals,
national_parks = national_parks,
population = population
)
rsa_env <- list2env(rsa_lst)
# Find the parent environment of rsa_env
parent <- parent.env(rsa_env)
# Print its name
environmentName(parent)parent = globalenv()
> environmentName(globalenv())
[1] "R_GlobalEnv"
> ls.str(globalenv())
capitals : Classes 'tbl_df', 'tbl' and 'data.frame': 3 obs. of 2 variables:
$ city : chr "Cape Town" "Bloemfontein" "Pretoria"
$ type_of_capital: chr "Legislative" "Judicial" "Administrative"
data_dir : chr "/usr/local/share/datasets"
national_parks : chr [1:22] "Addo Elephant National Park" "Agulhas National Park" ...
population : Time-Series [1:5] from 1996 to 2016: 40583573 44819778 47390900 51770560 55908900
rsa_env : <environment: 0x55ff9a6a43c0>
rsa_lst : List of 3
$ capitals :Classes 'tbl_df', 'tbl' and 'data.frame': 3 obs. of 2 variables:
$ national_parks: chr [1:22] "Addo Elephant National Park" "Agulhas National Park" "Ai-Ais/Richtersveld Transfrontier Park" "Augrabies Falls National Park" ...
$ population : Time-Series [1:5] from 1996 to 2016: 40583573 44819778 47390900 51770560 55908900
> ls.str(rsa_env)
capitals : Classes 'tbl_df', 'tbl' and 'data.frame': 3 obs. of 2 variables:
$ city : chr "Cape Town" "Bloemfontein" "Pretoria"
$ type_of_capital: chr "Legislative" "Judicial" "Administrative"
national_parks : chr [1:22] "Addo Elephant National Park" "Agulhas National Park" ...
population : Time-Series [1:5] from 1996 to 2016: 40583573 44819778 47390900 51770560 55908900两者之间还是有区别的,可以看出从属关系。
# Compare the contents of the global environment and rsa_env
ls.str(globalenv())
ls.str(rsa_env)

# Does population exist in rsa_env?
exists("population", envir = rsa_env)

# Does population exist in rsa_env, ignoring inheritance?
exists("population", envir = rsa_env, inherits = FALSE)
4.6 Scope and precedence
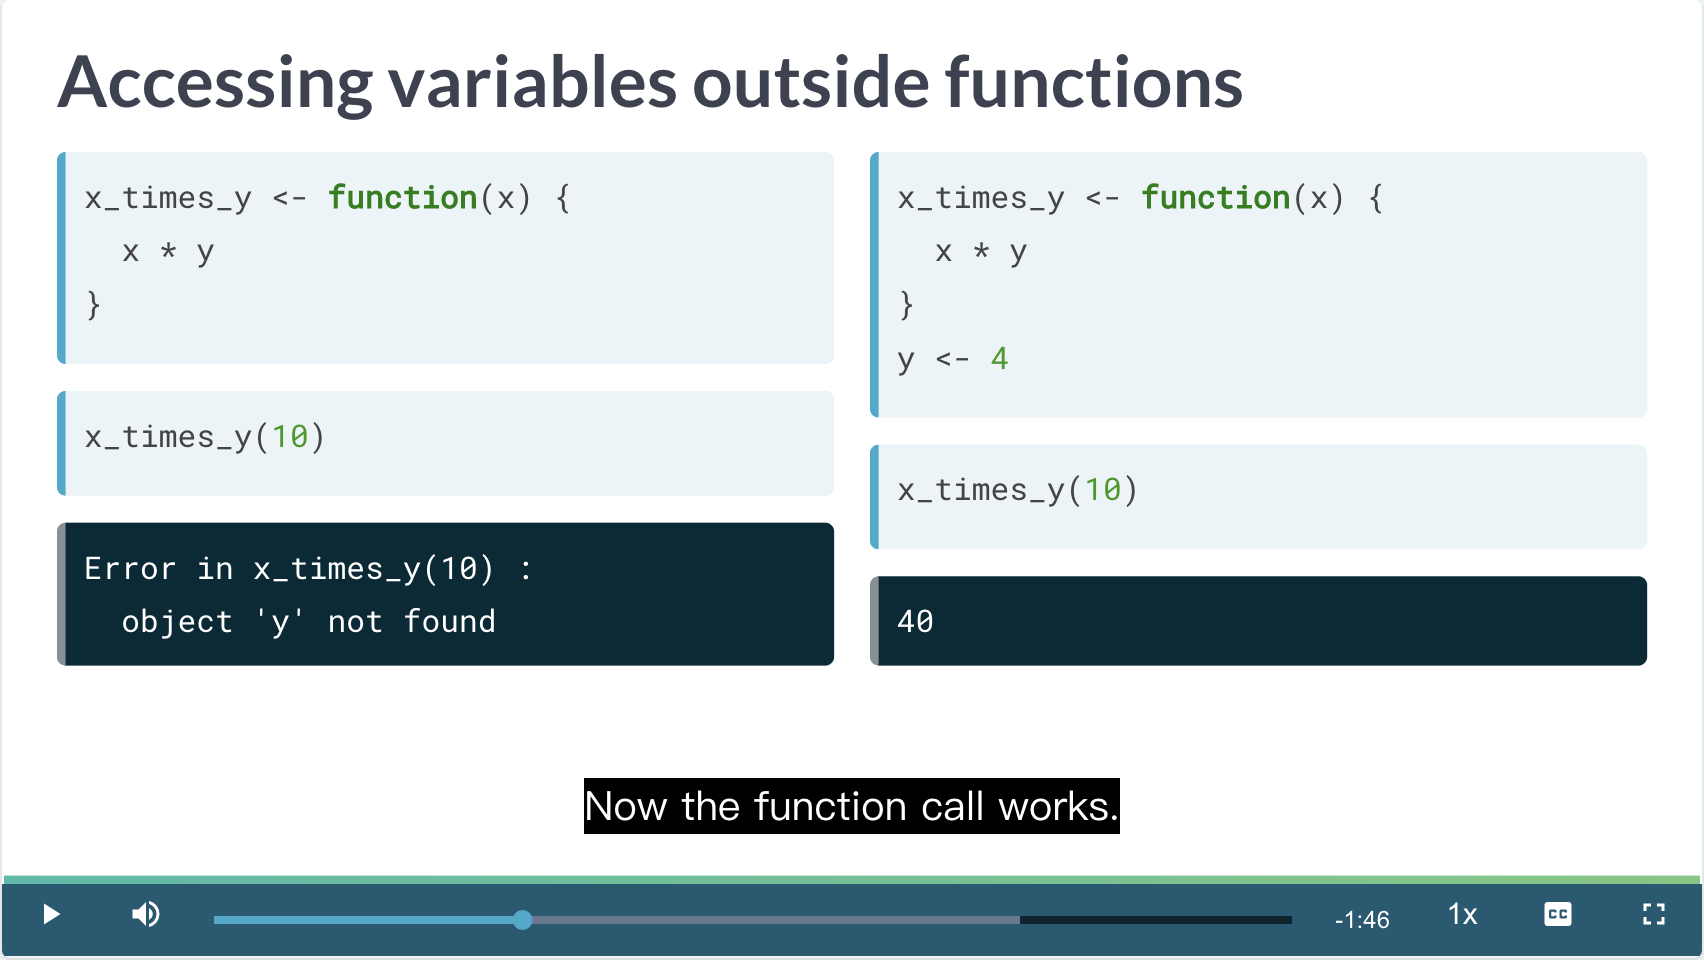
为什么要默认贪婪?
因为当当前环境没有y时,默认的 inherit 会去上层环境寻找 y,因此从使用习惯上,只要在上层环境进行了y的定义,函数就是 work 的。
但是寻找是有顺序的,如果在内部环境已经定义了y,那么当 exists 已经寻找到 y,就不再会去上层环境寻找了。

Inside and Outside
5 案例分析
数据下载见 U.S. Historical Crop Yields By State
5.1 函数构建
Unfortunately, they report all areas in acres. So, the first thing you need to do is write some utility functions to convert areas in acres to areas in hectares. (Mayr 2019)
- There are 4840 square yards in an acre.
- There are 36 inches in a yard and one inch is 0.0254 meters.
- There are 10000 square meters in a hectare.
acre => yard => inch => meter => hectare
You’re almost there with creating a function to convert acres to hectares. (Mayr 2019)
为什么要告诉以上的转化关系,因为需要进行 Mayr (2019) 需要的计量单位。
# Write a function to convert acres to sq. yards
acres_to_sq_yards <- function(acres) {
  acres * 4840
}
# Write a function to convert yards to meters
yards_to_meters <- function(yards) {
yards * 36 * 0.0254
}# Write a function to convert sq. meters to hectares
sq_meters_to_hectares <- function(sq_meters) {
sq_meters/10000
}# Write a function to convert sq. yards to sq. meters
sq_yards_to_sq_meters <- function(sq_yards) {
sq_yards %>%
# Take the square root
sqrt() %>%
# Convert yards to meters
yards_to_meters() %>%
# Square it
raise_to_power(2)
}# Load the function from the previous step
load_step2()
# Write a function to convert acres to hectares
acres_to_hectares <- function(acres) {
acres %>%
# Convert acres to sq yards
acres_to_sq_yards() %>%
# Convert sq yards to sq meters
sq_yards_to_sq_meters() %>%
# Convert sq meters to hectares
sq_meters_to_hectares()
}Amazing area conversion! By breaking down this conversion into lots of simple functions, you have easy to read code, which helps guard against bugs. (Mayr 2019)
为什么要分类成很多小函数,方便 debug。
- One pound (lb) is 0.45359237 kilograms (kg).
- One bushel is 48 lbs of barley, 56 lbs of corn, or 60 lbs of wheat.
bushel => pound => kilograms
# Write a function to convert lb to kg
lbs_to_kgs <- function(lbs) {
  lbs * 0.45359237
}
# Write a function to convert bushels to lbs
bushels_to_lbs <- function(bushels, crop) {
# Define a lookup table of scale factors
c(barley = 48, corn = 56, wheat = 60) %>%
# Extract the value for the crop
extract(crop) %>%
# Multiply by the no. of bushels
multiply_by(bushels)
}extract 有点 switch 的感觉。
# Load fns defined in previous steps
load_step3()

# Write a function to convert bushels to kg
bushels_to_kgs <- function(bushels, crop) {
  bushels %>%
    # Convert bushels to lbs
    bushels_to_lbs(crop) %>%
    # Convert lbs to kgs
    lbs_to_kgs()
}
# Load fns defined in previous steps
load_step4()
# Write a function to convert bushels/acre to kg/ha
bushels_per_acre_to_kgs_per_hectare <- function(bushels_per_acre, crop = c("barley", "corn", "wheat")) {
# Match the crop argument
crop <- match.arg(crop)
bushels_per_acre %>%
# Convert bushels to kgs
bushels_to_kgs(crop) %>%
# Convert acres to ha
acres_to_hectares()
}You now have a full stack of functions for converting the units. (Mayr 2019)
函数完全复合了。
5.2 应用
# View the corn dataset
glimpse(corn)

corn %>%
  # Add some columns
  mutate(
    # Convert farmed area from acres to ha
    farmed_area_ha = acres_to_hectares(farmed_area_acres),
    # Convert yield from bushels/acre to kg/ha
    yield_kg_per_ha = bushels_per_acre_to_kgs_per_hectare(
      yield_bushels_per_acre,
      crop = "corn"
    )
  )
# Wrap this code into a function
fortify_with_metric_units <- function(data, crop) {
data %>%
mutate(
farmed_area_ha = acres_to_hectares(farmed_area_acres),
yield_kg_per_ha = bushels_per_acre_to_kgs_per_hectare(
yield_bushels_per_acre,
crop = crop
)
)
}
# Try it on the wheat dataset
fortify_with_metric_units(wheat, "wheat")Mayr (2019) 有一个很好的思路,就是把很多 script => R functions.
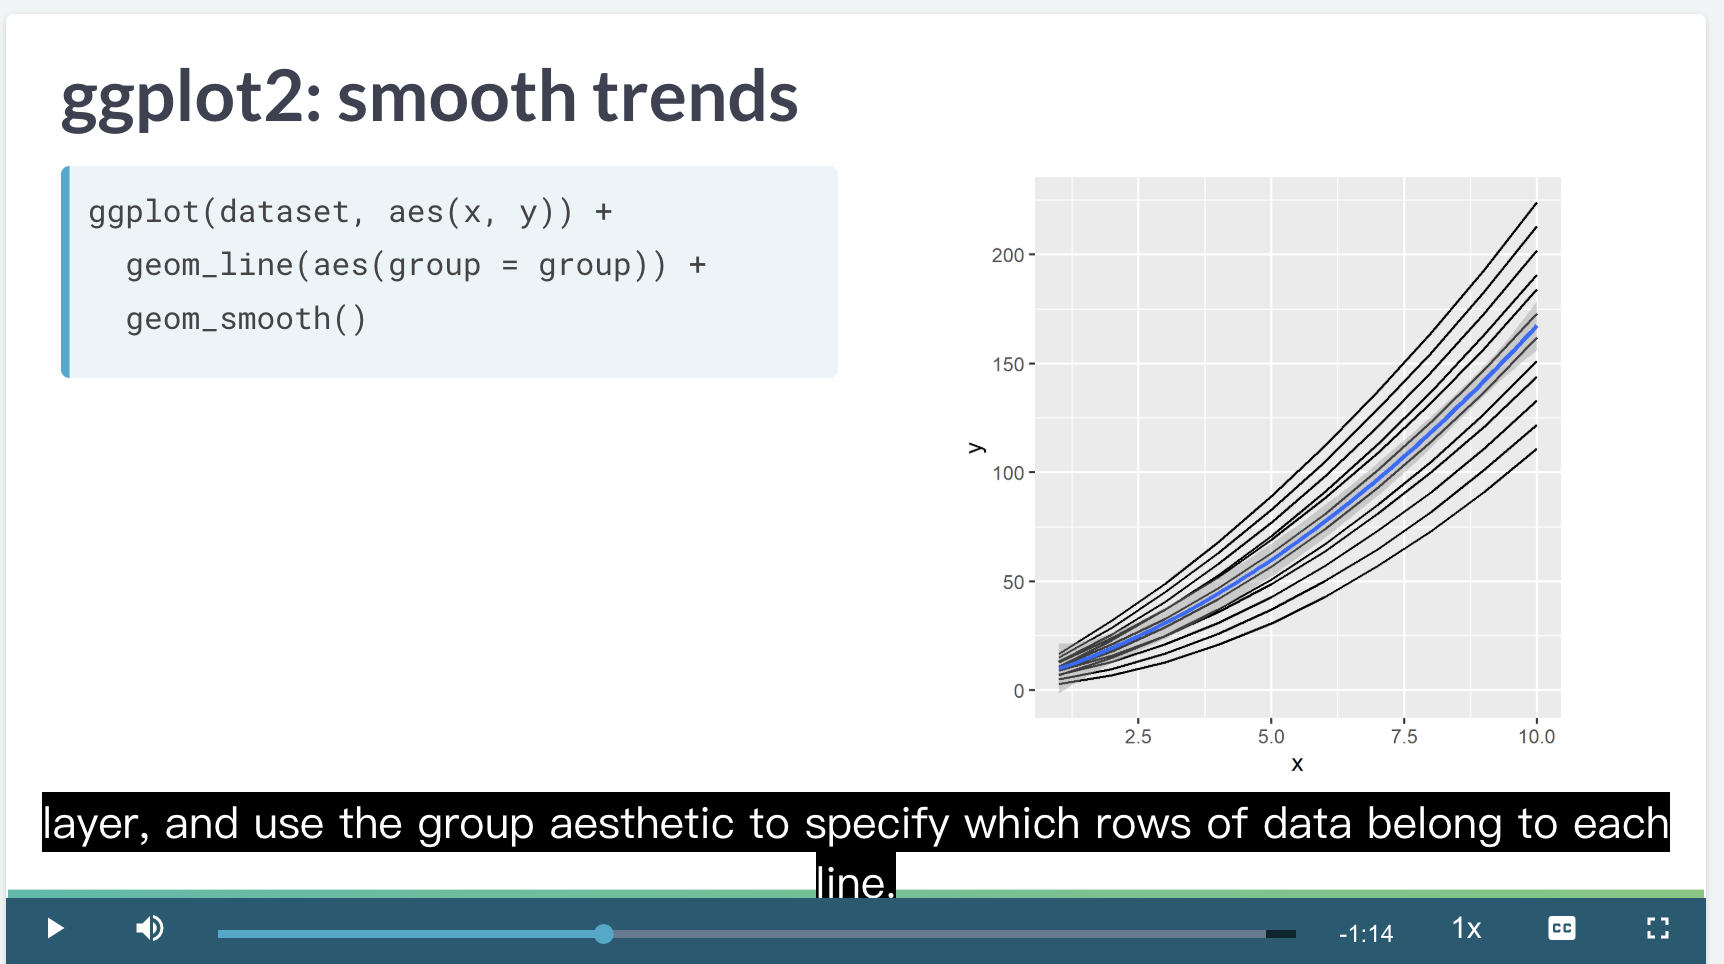
当只增加 group 颜色没有变化,但是 lines 会分开,加上 smooth 会增加一个回归线。
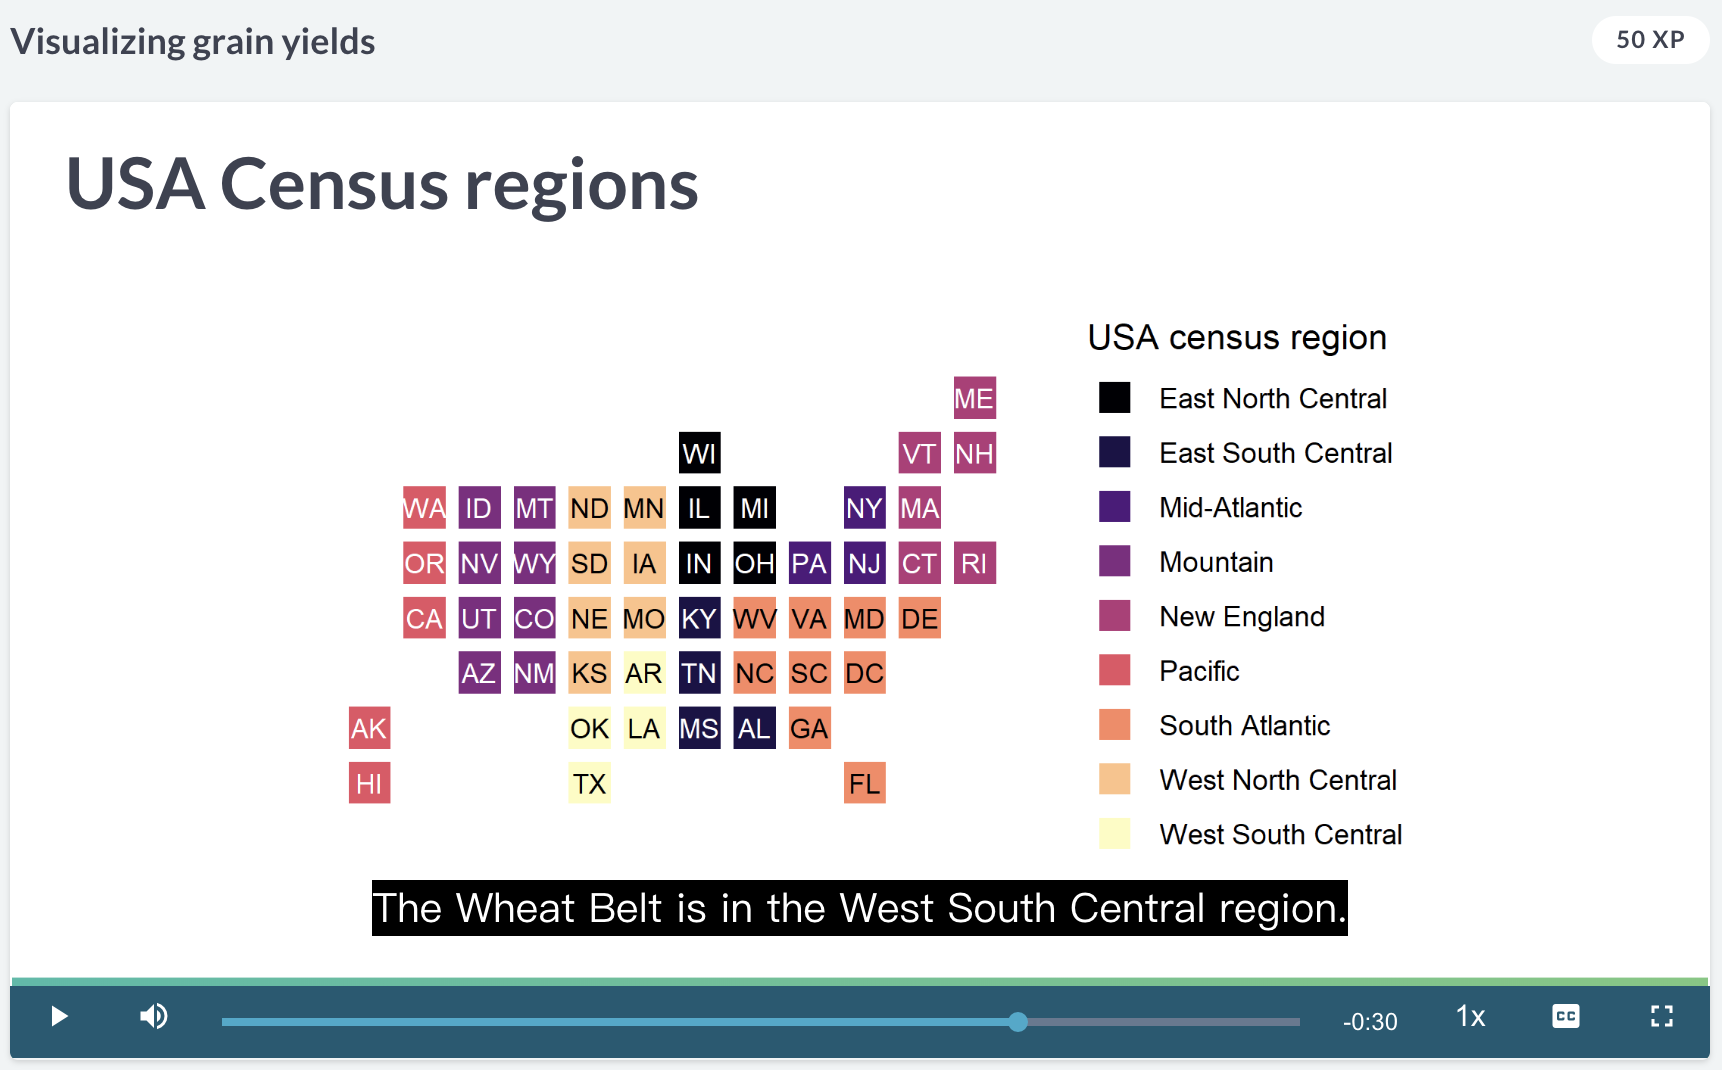
crop belt
- corn belt 在美国中部的上方
- wheat belt 在美国中部的下方
The “Corn Belt”, where most US corn is grown is in the “West North Central” and “East North Central” regions. The “Wheat Belt” is in the “West South Central” region. (Mayr 2019)
# Wrap this plotting code into a function
plot_yield_vs_year <- function(data) {
  ggplot(data, aes(year, yield_kg_per_ha)) +
    geom_line(aes(group = state)) +
    geom_smooth()
}

# Test it on the wheat dataset
plot_yield_vs_year(corn)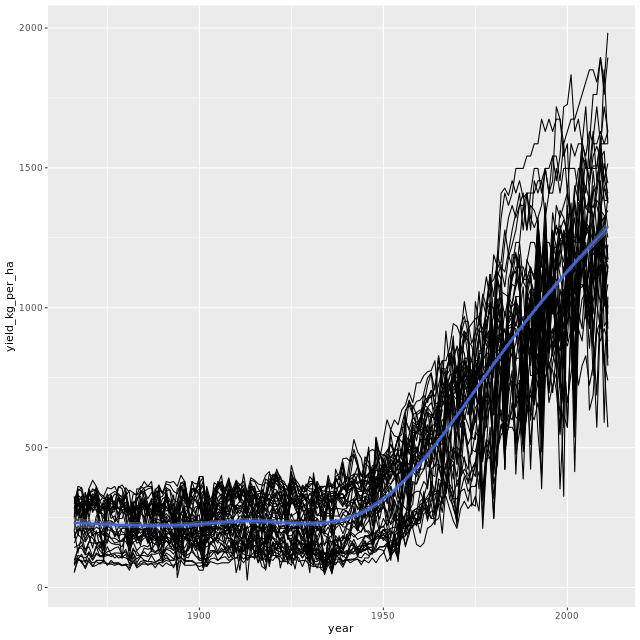
单位产出逐年变化
Look at the huge increase in yields from the time of the Green Revolution in the 1950s. (Mayr 2019)
# Plot yield vs. year for the corn dataset
plot_yield_vs_year(corn) +
  # Facet, wrapped by census region
  facet_wrap(~ census_region)
这种再分开看的思路很好,为什么可以先画总体,觉得不错后,再 facet_wrap,思路上有建设意义。
# Wrap this code into a function
plot_yield_vs_year_by_region <- function(data) {
  plot_yield_vs_year(data) +
    facet_wrap(vars(census_region))
}

# Try it on the wheat dataset
plot_yield_vs_year_by_region(wheat)
这里也聚合成函数。
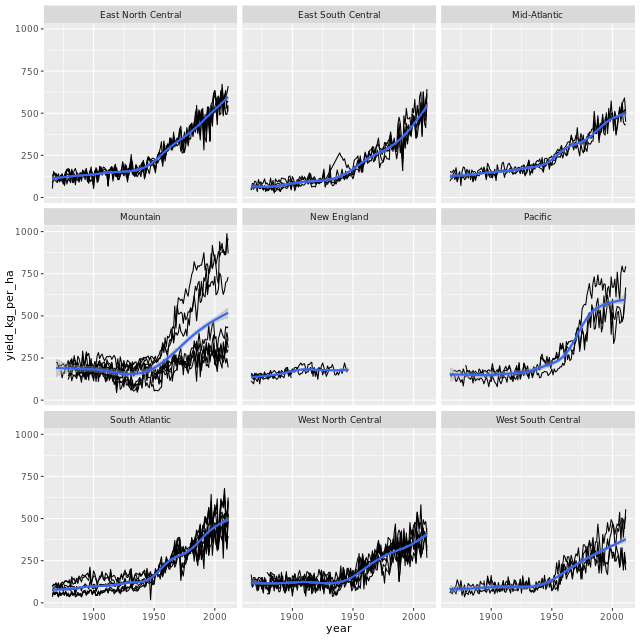
分地区查看
Reassuringly, the corn yields are highest in the West North Central region, the heart of the Corn Belt. For wheat, it looks like the yields are highest in the Wheat Belt (West South Central region) have been overtaken by some other regions. (Mayr 2019)
5.3 GAM
The run a GAM, load the mgcv package, which stands for “mixed GAM computational vehicle”. (Mayr 2019)
一般使用 mgcv 包进行GAM估计。

gam模型参数区别
s()means “make the variable smooth”, where smooth very roughly means nonlinear.
# Wrap the model code into a function
library(mgcv)
run_gam_yield_vs_year_by_region <- function(data) {
  gam(yield_kg_per_ha ~ s(year) + census_region, data = corn)
}

# Try it on the wheat dataset
run_gam_yield_vs_year_by_region(wheat)Family: gaussian
Link function: identity
Formula:
yield_kg_per_ha ~ s(year) + census_region
Estimated degrees of freedom:
7.64 total = 16.64
GCV score: 16492.4# Wrap this prediction code into a function
predict_yields <- function(model, year) {
predict_this <- data.frame(
year = year,
census_region = census_regions
)
pred_yield_kg_per_ha <- predict(model, predict_this, type = "response")
predict_this %>%
mutate(pred_yield_kg_per_ha = pred_yield_kg_per_ha)
}
# Try it on the wheat dataset
predict_yields(wheat_model, 2050) year census_region pred_yield_kg_per_ha
1 2050 New England 721.4165
2 2050 Mid-Atlantic 710.8364
3 2050 East North Central 716.6605
4 2050 West North Central 652.9921
5 2050 South Atlantic 665.5007
6 2050 East South Central 653.2159
7 2050 West South Central 624.1999
8 2050 Mountain 715.0535
9 2050 Pacific 747.8053Barley prefers a cooler climate compared to corn and wheat and is commonly grown in the US mountain states of Idaho and Montana. (Mayr 2019)
barley 大麦。
Hopefully, by now, you’ve realized that the real benefit to writing functions is that you can reuse your code easily. Now you are going to rerun the whole analysis from this chapter on a new crop, barley. Since all the infrastructure is in place, that’s less effort than it sounds! (Mayr 2019)
直接可以复用。
dplyrandggplot2, and mgcv are loaded;fortify_with_metric_units(),fortify_with_census_region(),plot_yield_vs_year_by_region(),run_gam_yield_vs_year(), andpredict_yields()are available.
one-line functions 简化 script,就需要这几个步骤就可以搞定,大大简化 script 的书写。
fortified_barley <- barley %>%
  # Fortify with metric units
  fortify_with_metric_units() %>%
  # Fortify with census regions
  fortify_with_census_region()

# See the result
glimpse(fortified_barley)
# Plot yield vs. year by region
plot_yield_vs_year_by_region(fortified_barley)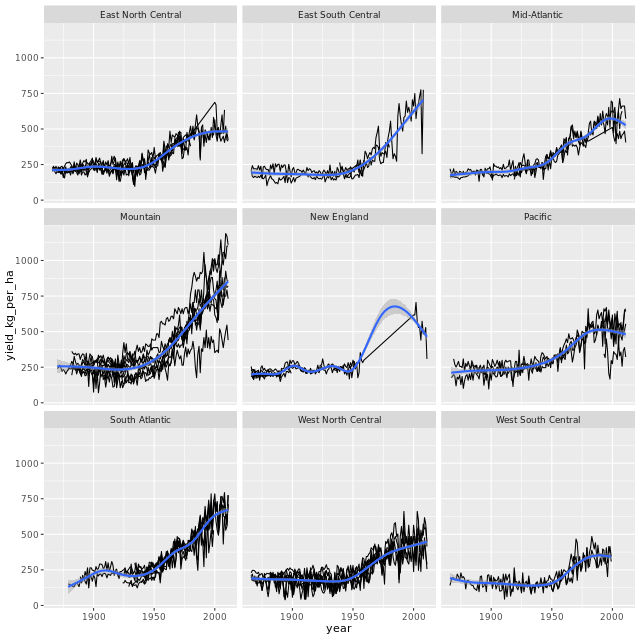
分地区表现
fortified_barley %>%
  # Run a GAM of yield vs. year by region
  run_gam_yield_vs_year_by_region()  %>%
  # Make predictions of yields in 2050
  predict_yields(2050)
year census_region pred_yield_kg_per_ha
1 2050 New England 692.7372
2 2050 Mid-Atlantic 695.6051
3 2050 East North Central 689.5561
4 2050 West North Central 629.5246
5 2050 South Atlantic 695.7666
6 2050 East South Central 657.6750
7 2050 West South Central 595.9212
8 2050 Mountain 759.6959
9 2050 Pacific 698.9621附录
5.4 gold_medals 数据描述
gold_medals, a numeric vector of the number of gold medals won by each country in the 2016 Summer Olympics, is provided. Note that the medal count for Independent Olympic Athletes (“IOC” – those who competed without a country) is missing.
这些金牌统计中,IOC 表示这些金牌的获得是没有归属的国家的。
5.5 完成证书
参考文献
Mayr, Sascha. 2019. “Introduction to Function Writing in R.” DataCamp. 2019. https://www.datacamp.com/courses/introduction-to-function-writing-in-r.