r_eda
打通连续变量和分类变量画图的差异
suppressMessages(source("R/load.R"))
mtcars %>%
rownames_to_column('index1') %>%
mutate(index1 = index1 %>% as.factor) %>%
mutate(index2 = index1 %>% as.integer) -> df
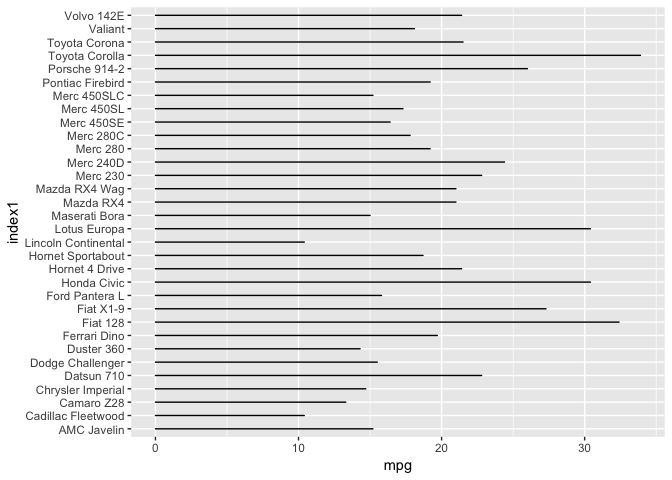
df %>%
ggplot() +
geom_area(aes(x = index1, y = mpg), color = 'black', fill = 'black') +
coord_flip()
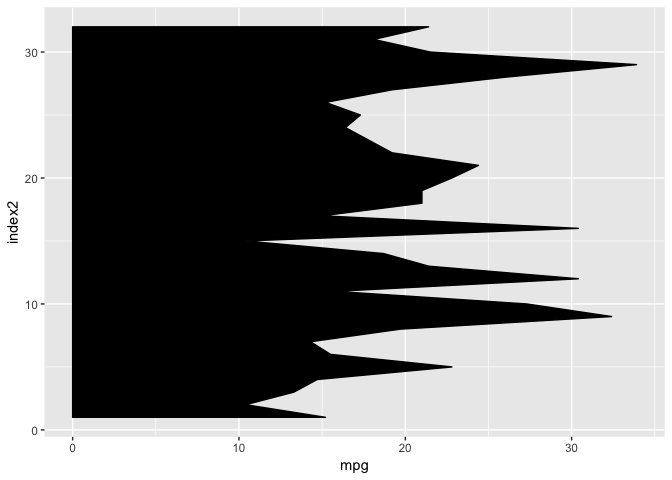
df %>%
    ggplot() +
    geom_area(aes(x = index2, y = mpg), color = 'black', fill = 'black') +
    coord_flip()
- 分类变量不能承接连续变量的图
- 连续变量不能承接分类变量的刻度
df %.>%
  ggplot(data = .) +
  geom_area(aes(x = index2, y = mpg), color = 'black', fill = 'black') +
  coord_flip() +
  scale_x_continuous(
    breaks = .$index2,
    labels = .$index1
  )
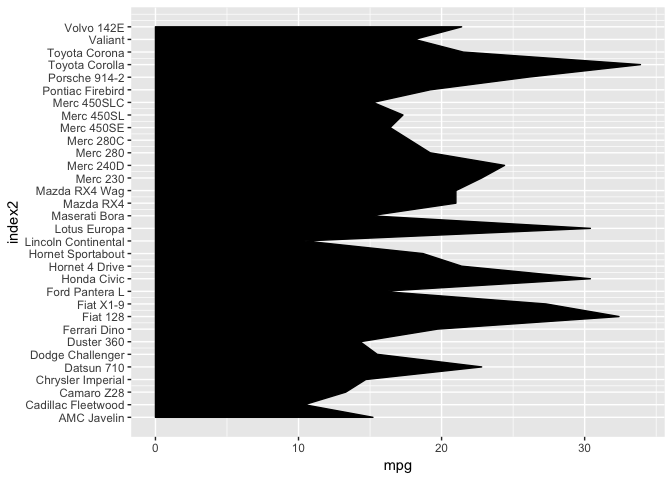
这里进行说明, 这里还是scale_x_continuous的 base,
breaks也不变,还是.$index2,但是labels = .$index1进行了修改。