一级标题
In [9]:
# from pyecharts.globals import CurrentConfig, NotebookType
# CurrentConfig.NOTEBOOK_TYPE = NotebookType.JUPYTER_LAB
In [1]:
import seaborn as sns
import matplotlib.pyplot as plt
from pyecharts import options as opts
from pyecharts.charts import Bar, Line
from pyecharts.faker import Faker

%matplotlib inline
二级标题
In [3]:
v1 = [2.0, 4.9, 7.0, 23.2, 25.6, 76.7, 135.6, 162.2, 32.6, 20.0, 6.4, 3.3]
v2 = [2.6, 5.9, 9.0, 26.4, 28.7, 70.7, 175.6, 182.2, 48.7, 18.8, 6.0, 2.3]
v3 = [2.0, 2.2, 3.3, 4.5, 6.3, 10.2, 20.3, 23.4, 23.0, 16.5, 12.0, 6.2]
三级标题
In [4]:
bar = (
    Bar()
    .add_xaxis(Faker.months)
    .add_yaxis("蒸发量", v1)
    .add_yaxis("降水量", v2)
    .extend_axis(
        yaxis=opts.AxisOpts(
            axislabel_opts=opts.LabelOpts(formatter="{value} °C"), interval=5
        )
    )
    .set_series_opts(label_opts=opts.LabelOpts(is_show=False))
    .set_global_opts(
        title_opts=opts.TitleOpts(title="Overlap-bar+line"),
        yaxis_opts=opts.AxisOpts(axislabel_opts=opts.LabelOpts(formatter="{value} ml")),
    )
)

line = Line().add_xaxis(Faker.months).add_yaxis("平均温度", v3, yaxis_index=1)
bar.overlap(line)
# bar.load_javascript()
Out[4]:
可视化
In [5]:
bar.render_notebook()
Out[5]:
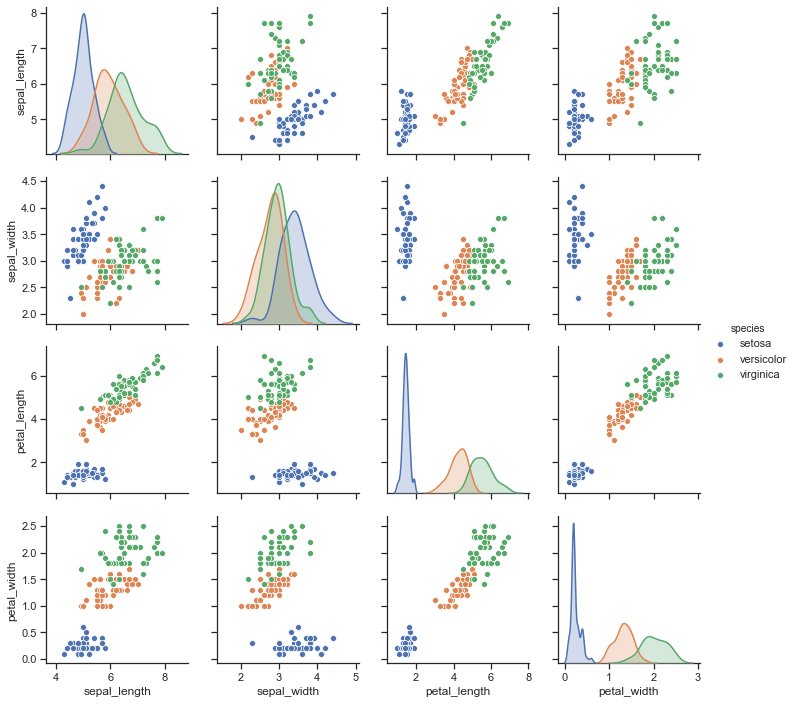
In [6]:
sns.set(style="ticks", color_codes=True)
iris = sns.load_dataset("iris")
g = sns.pairplot(iris, hue="species")
In [ ]: