商业分析 学习笔记
2019-12-28
1 主要内容
参考 Semaan (2019) 和 Rosok (2019) 进行商业数据分析学习, 有一部分是 Python 的,但是都是报表类的比较好理解。 对应封装的 Python 包见 conversion_metrics
主要涉及内容分两块
报表
- produce report-ready results 可读的报表结果
- Revenue, cost, and profit 成本收益分析
- Common Table Expressions to figure out profit (with table) Github Pages
withtable 的使用 - how to calculate the registrations and active users KPIs, and use window functions to calculate the user growth and retention rates. 部分 KPI计算
- unit economics 单体经济
- Generating an executive report 执行报表
自动化和异常处理
- 函数自动化
- 转化率构成
- AB Test
2 KPI种类
常用指标
- Conversion and retention
- Registrations
- Active users (活跃)
- Growth
- Cohort analysis
2.1 Registrations
这很简单。
2.2 Stickiness
Active users KPI: Counts the active users of a company’s app over a time period
- by day (daily active users, or DAU)
- by month (monthly active users, or MAU)
Stickiness (DAU / MAU), measures how often users engage with an app on average
Stickiness 可以定义为用户时长。
Example: If Delivr’s stickiness is DAU / MAU = 0.3 (30%), users use Delivr for 30% x 30 days = 9 days each month on average
类似于 Higgins (2015 Chapter 3) 定义的 Pro Forma Statements
2.3 Growth
\[\begin{array}{l}{\text { Formula: } \frac{\text { Current value - Previous value}}{\text {Previous} \text { value}}} \\ {\text { Example: } \frac{67-50}{50}=0.34=34 \%}\end{array}\]
2.4 Retention
MAU - pitfalls MAU 的 bug
Doesn’t show the breakdown of active users by tenure Doesn’t distinguish between different patterns of user activity
- Case 1: 每月都有100人注册,但是次月都走了 (留存很低)
- Case 2: 只有100人注册,但是月月活跃 (留存很高)
Retention rate: A percentage measuring how many users who were active in a previous month are still active in the current month
因此才需要算留存率,这里可以定义为周期上的 t-1 和 t 即可。
\[\frac{U c}{U p}\]
where \(U c\) is the count of distinct users who were active in both the current and Up previous months, and \(U p\) is the count of distinct users who were active in the previous period
WITH user_activity AS (
    SELECT DISTINCT
        DATE_TRUNC('month', order_date) :: DATE AS delivr_month, user_id
    FROM orders
)
SELECT
    previous.delivr_month,
    ROUND(
        COUNT(DISTINCT current.user_id) :: NUMERIC /
        GREATEST(COUNT(DISTINCT previous.user_id), 1)
    , 2)
    AS retention
FROM user_activity AS previous
LEFT JOIN user_activity AS current
ON previous.user_id = current.user_id
    AND previous.delivr_month = (current.delivr_month - INTERVAL '1 month')
GROUP BY previous.delivr_month
ORDER BY previous.delivr_month ASC
LIMIT 3
;这里GREATEST(COUNT(DISTINCT previous.user_id), 1) 这一步处理很欣赏。
另外 previous.delivr_month = (current.delivr_month - INTERVAL '1 month') 也算是简洁的写法了。
之后的分析,类似于 cohort 内容。
2.5 conversion and retention rates
2.6 conversion attrs
2.7 Cohort 理论
主要跟留存分析相关, 由三部分组成
- cohort
- cohort index 频率可以和 cohort 不一致
- metrics 位于table中,可以是 retention rate 等
3 Defining a cohort
defining a cohort is the first step to cohort analysis. (Urbonas 2018)
一般有三种
- time cohort cohort 是一个稳定的时间间隔,如月、季度
- behavior cohort cohort 是一个流程顺序,如App注册的顺序
- size cohort cohort 如用户支付、用户购买频繁的size
应该看如何对 behavior 和 size 进行cohort,查询下。 这是让我感兴趣的。
cohort analysis = vanity metrics (Urbonas 2018)
todo vanity metrics 是什么? https://contentmarketinginstitute.com/2017/10/ways-use-vanity-metrics/
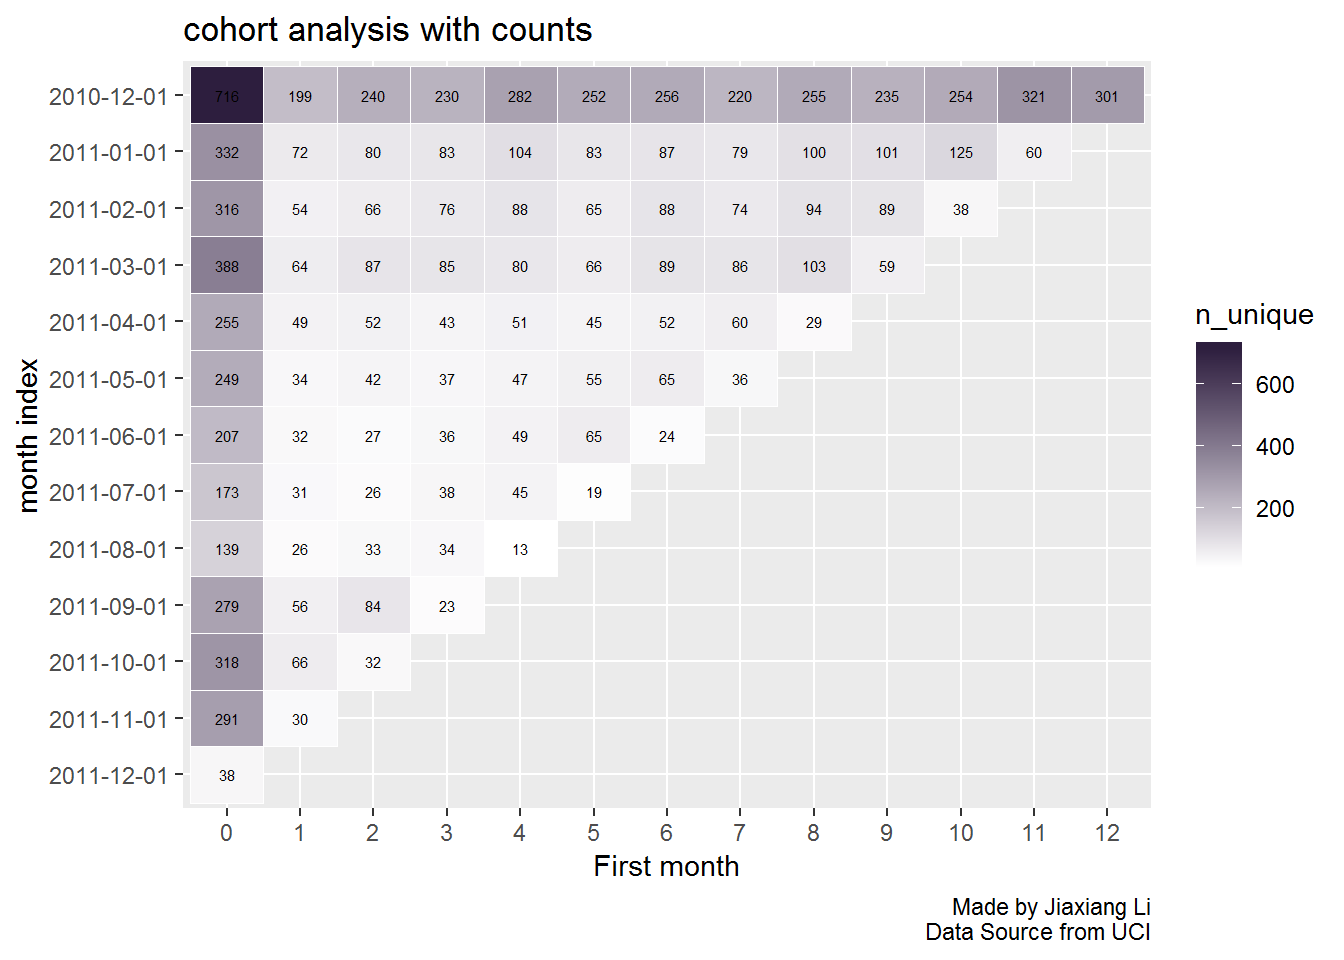
因此我们需要定义一些 metrics,常见的有
countmean(quantity)
Customer retention is a very useful metric to understand how many of the all customers are still active. (Urbonas 2018)
热力图参考 Jack Brookes
缺少 对 cohort 图的解读
3.1 Cohort 计算
参考 Urbonas (2018) 在Python中完成了 cohort 分析,方法是相同的,因此这里复现在R中的 cohort 分析。 Python 相关代码参考 ch1-cohort-py.html
## Warning: package 'purrr' was built under R version 3.6.1## Warning: package 'dplyr' was built under R version 3.6.1这里主要有两件事情需要做
- 建立 time cohort 和 cohort index
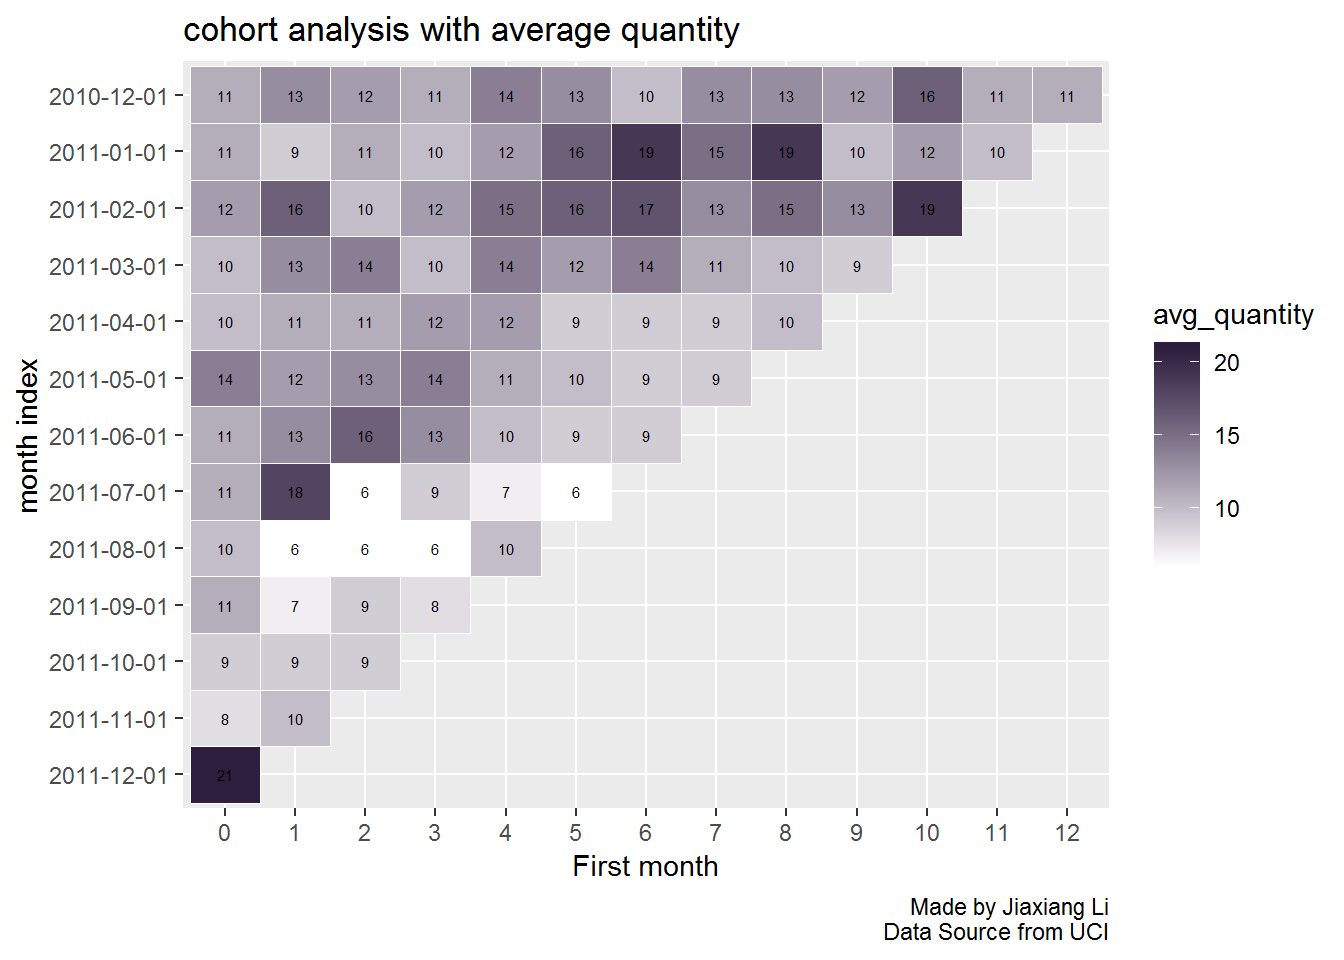
- 建立 cohort metrics,这里列举
- 人数
- 平均交易单价
实际上 time cohort 就是把首次时间和时间差算出来即可。 (Urbonas 2018, chap. 1)
suppressMessages(library(lubridate))
cohort_ana <-
    online %>%
    group_by(CustomerID) %>%
    mutate(
        InvoiceDate = as.Date(InvoiceDate)
        ,first_invoice_date = min(InvoiceDate)
        ,first_invoice_month = floor_date(first_invoice_date,unit = 'month')
        ,cohort_index_day = InvoiceDate - first_invoice_date + 1 # avoid zero
        ,cohort_index_month = as.integer(cohort_index_day)/30
        ,cohort_index_month = cohort_index_month %>% round()
    ) %>%
    ungroup() %>%
    group_by(first_invoice_month,cohort_index_month) %>%
    summarise(
        n_unique = n_distinct(CustomerID)
        ,avg_quantity = mean(Quantity) %>% round()
    )
cohort_ana %>%
ggplot(aes(y = first_invoice_month %>%
as.factor() %>%
fct_reorder(first_invoice_month,.desc = T)
,x = str_sub(cohort_index_month,1,7) %>%
fct_reorder(cohort_index_month)
)) +
geom_tile(aes(fill = n_unique),color='white') +
# color 是加边框
geom_text(aes(label = n_unique),size = 2) +
scale_fill_gradient(low = 'white', high = '#2d1e3e', space = 'Lab', na.value = 'white') +
# 改变瓦砾的颜色
labs(
x = 'First month'
,y = 'month index'
,title = 'cohort analysis with counts'
,caption = 'Made by Jiaxiang Li\nData Source from UCI'
)
cohort_ana %>%
    ggplot(aes(y = first_invoice_month %>%
                   as.factor() %>%
                   fct_reorder(first_invoice_month,.desc = T)
               ,x = str_sub(cohort_index_month,1,7) %>%
                   fct_reorder(cohort_index_month)
               )) +
    geom_tile(aes(fill = avg_quantity),color='white') +
    # color 是加边框
    geom_text(aes(label = avg_quantity),size = 2) +
    scale_fill_gradient(low = 'white', high = '#2d1e3e', space = 'Lab', na.value = 'white') +
    # 改变瓦砾的颜色
    labs(
        x = 'First month'
        ,y = 'month index'
        ,title = 'cohort analysis with average quantity'
        ,caption = 'Made by Jiaxiang Li\nData Source from UCI'
    )
4 automation
5 单体经济
Average Revenue Per User (ARPU)
\[\text { Formula: } \frac{\text {Revenue}}{\text {Count of users}}\]
Use: Measures a company’s success in scaling its business model
类似于 Higgins (2015 Chapter 3) 定义的 Pro Forma Statements

image
我发现 with tables 很常见,这本身就是用 SQL 进行数据分析的正常思路。
6 ab test
7 附录
7.1 CTEs
\[\text { Profit }=\text { Revenue }-\text { Cost }\]
这是核心口径。
Common Table Expressions (CTEs) 公共表表达式 就是 with tables
- Profit per user: Identify the “best” users
- Profit per meal/click: Identify the most profitable meals/channels
- Profit per month: Tracks profit over time
找出性价比最高的用户。
7.2 可读性
Readability
Dates: Use readable date formats ( August 2018 , not 2018-08-01 ) Numbers: Round numbers to the second decimal at most ( 98.76 , not 98.761234 ) Table shape: Reshape long tables into wide ones, pivoting by date when possible Order: Don’t forget to sort!
Dates 我下次要注意把年份去掉。
7.3 skewness

image
这个 skewness 图比较有 sense。
7.4 andas and plot
7.5 异常值探查
If max >> median, it is an outlier or merit.
这是一种经验法则,用箱型图就可以查看。
7.6 day of week
参考文献
Higgins, Robert. 2015. Analysis for Financial Management. 11th ed. McGraw-Hill Education.
Rosok, Jill. 2019. “Analyzing Marketing Campaigns with Pandas.” DataCamp. 2019. https://www.datacamp.com/courses/analyzing-marketing-campaigns-with-pandas.
Semaan, Michel. 2019. “Analyzing Business Data in Sql.” DataCamp. 2019. https://www.datacamp.com/courses/analyzing-business-data-in-sql.
Urbonas, Karolis. 2018. “Customer Segmentation in Python.” 2018. https://www.datacamp.com/courses/customer-segmentation-in-python.